Sports Betting Line Movement: How to Read Odds Shifts
Learn what causes sports betting line movement, how to read shifts across sportsbooks, and how to use them in your betting analysis.
More than 78% of NFL games moved by a point or less between the opening and closing spread in an academic study of 2,560 regular-season games. That baseline reframes sports betting line movement: the useful question isn't whether a number moved, but whether the change matters at the price you can still get.
For DraftKings and FanDuel bettors, a flashing odds update isn't a betting recommendation. You need to separate the spread from its price, distinguish a persistent adjustment from a temporary reaction, and compare the available wager with your own estimate.
Typical Line Move Sizes and What They Mean
NFL spread movement by size band
| Move size | Share of NFL games | How to read it |
|---|---|---|
| 0.5 points or less | About 60.5% (1,548 of 2,560 games) | Common; check whether it crosses a key number such as 3 |
| Over 0.5 up to 1 point | Roughly 17% to 18% | Normal range; judge by context rather than size alone |
| More than 1 point | About 22% | Uncommon; look for injury news, weather or a move on several books |
An academic analysis of NFL regular-season games from 2002 through 2011 found that roughly 78% of games moved by a point or less between the opening and closing spread. That result is the basis for the bands above: the smallest band covers 1,548 of 2,560 games, the middle band is the approximate remainder, and the rest moved more than a point.
The baseline matters because bettors can mistake an ordinary adjustment for an extraordinary signal. A modest move doesn't prove anyone holds decisive information, and a large move doesn't make the new price attractive. Size also says nothing about staying power. A one-point move that holds until kickoff carries different information than the same move that retraces before game time, and a spread can sit perfectly still while the odds attached to it get more expensive.
Settlement matters more than visual size. A half-point change crossing the football key number of three can alter whether a particular winning margin produces a win, loss or push. A larger change elsewhere doesn't necessarily affect the same meaningful outcome.
A quick context check
Before interpreting a spread change, ask:
- Magnitude: How far did the spread move from the opening number?
- Settlement: Did it cross a key number, or merely move between less consequential thresholds?
- Breadth: Is the adjustment visible at other legal sportsbooks?
- Persistence: Has the new number held, or is the line already drifting back toward the opener?
Those questions describe the wager more precisely than calling it a big move. They also prevent a common analytical shortcut: assuming the latest number must be the best forecast.
In the same NFL analysis, opening spreads had slightly lower mean squared prediction error than closing spreads, although the difference was generally small and statistically insignificant. Movement is information to weigh, not proof of the correct side.
How to Track Movement Across Sportsbooks
Tracking works only when you compare like with like. Keep the game, market, settlement rules and sportsbook panel consistent, and distinguish each book's genuine opener from the first price you happened to observe.
Use this workflow to organize the comparison.
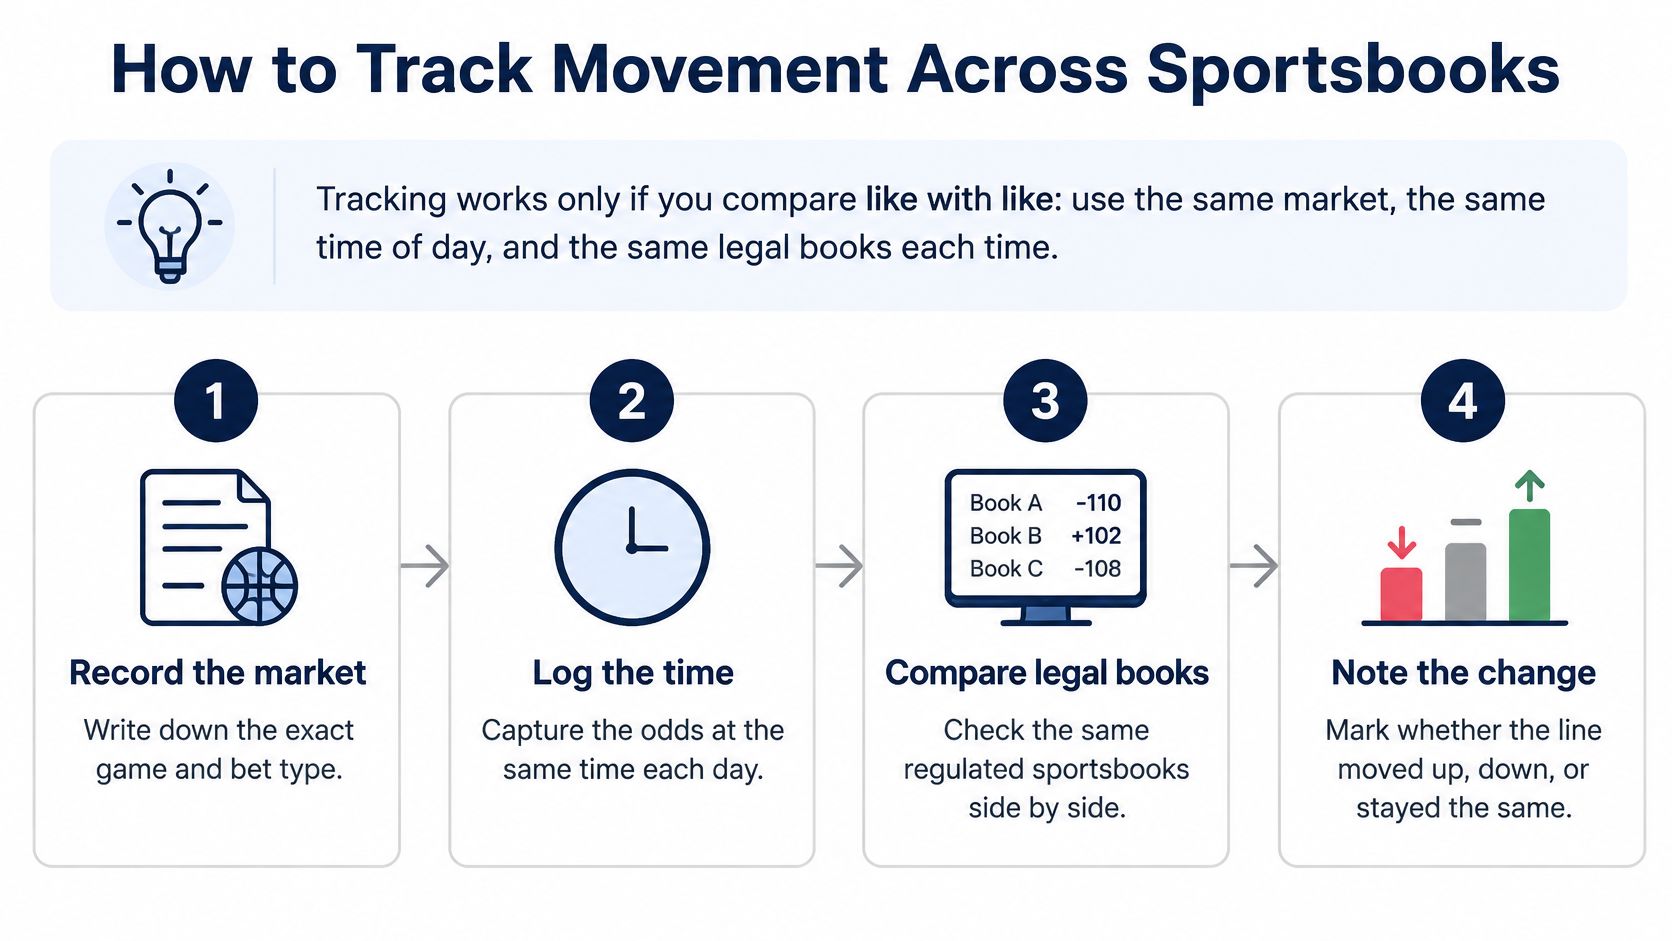
Build a timestamped record
Record the opening market and price. Save the spread, total or moneyline, the selected side, sportsbook and timestamp. If you missed the opener, label your entry first observed rather than treating it as the opening line without note.
Capture the same market from three or four legal books at the same moment as a practical sampling routine. Checking one app and returning to another much later can make a market-wide adjustment look like a disagreement.
Separate the number from the price. Give each its own field so unchanged spreads don't conceal more expensive odds. Don't record only the large number displayed beside the team.
Schedule intermediate checks. For example, take a reading one to two hours before your usual betting time, then another 30 to 60 minutes later; these are workflow choices, not proven optimal intervals.
Mark who moved first and who followed. Record whether several books changed within minutes or an isolated operator adjusted while others held. Avoid labeling every cross-book difference a coordinated move.
Check contemporaneous injury reports, weather and confirmed lineups. Save the announcement time separately from the time you noticed it, because an apparent explanation may have arrived after the adjustment.
Save the final available pregame number. Record the closing spread and price before kickoff or first pitch. Don't substitute an in-play quote, and mark missing observations rather than filling them from memory.
Keep the log usable
Use a spreadsheet with one summary row per game and market, backed by timestamped book-level observations. A sample row can read:
| Game and market | Open | Intermediate | Close | News checked |
|---|---|---|---|---|
| Hypothetical matchup, favorite spread | Opening spread and price by book | First adjustment, follow-through and retracement | Final pregame spread and price | Official availability report, lineup announcement and weather timestamp |
Keep your actual bet in a separate field from the available quotes. Otherwise, you can accidentally evaluate an entry price you saw but never obtained.
Practical rule: A missing observation is better than an invented history. Your log should distinguish what you recorded from what you inferred.
What Makes Sportsbooks Move a Line
A sportsbook line works like a store's price tag: the operator can replace it when demand changes or new information changes the product's value. The updated tag tells you the current asking price, not the complete reason behind it.
The sports-betting textbook's chapter on line movement identifies three principal drivers: disproportionate money on a side, new information such as injuries or weather, and wagers from bettors the book identifies as sharp. It describes typical steam moves as approximately 0.5 to 2 points within 5 to 30 minutes, while noting that individual events differ.
The distinction between demand and information is important when interpreting an adjustment.
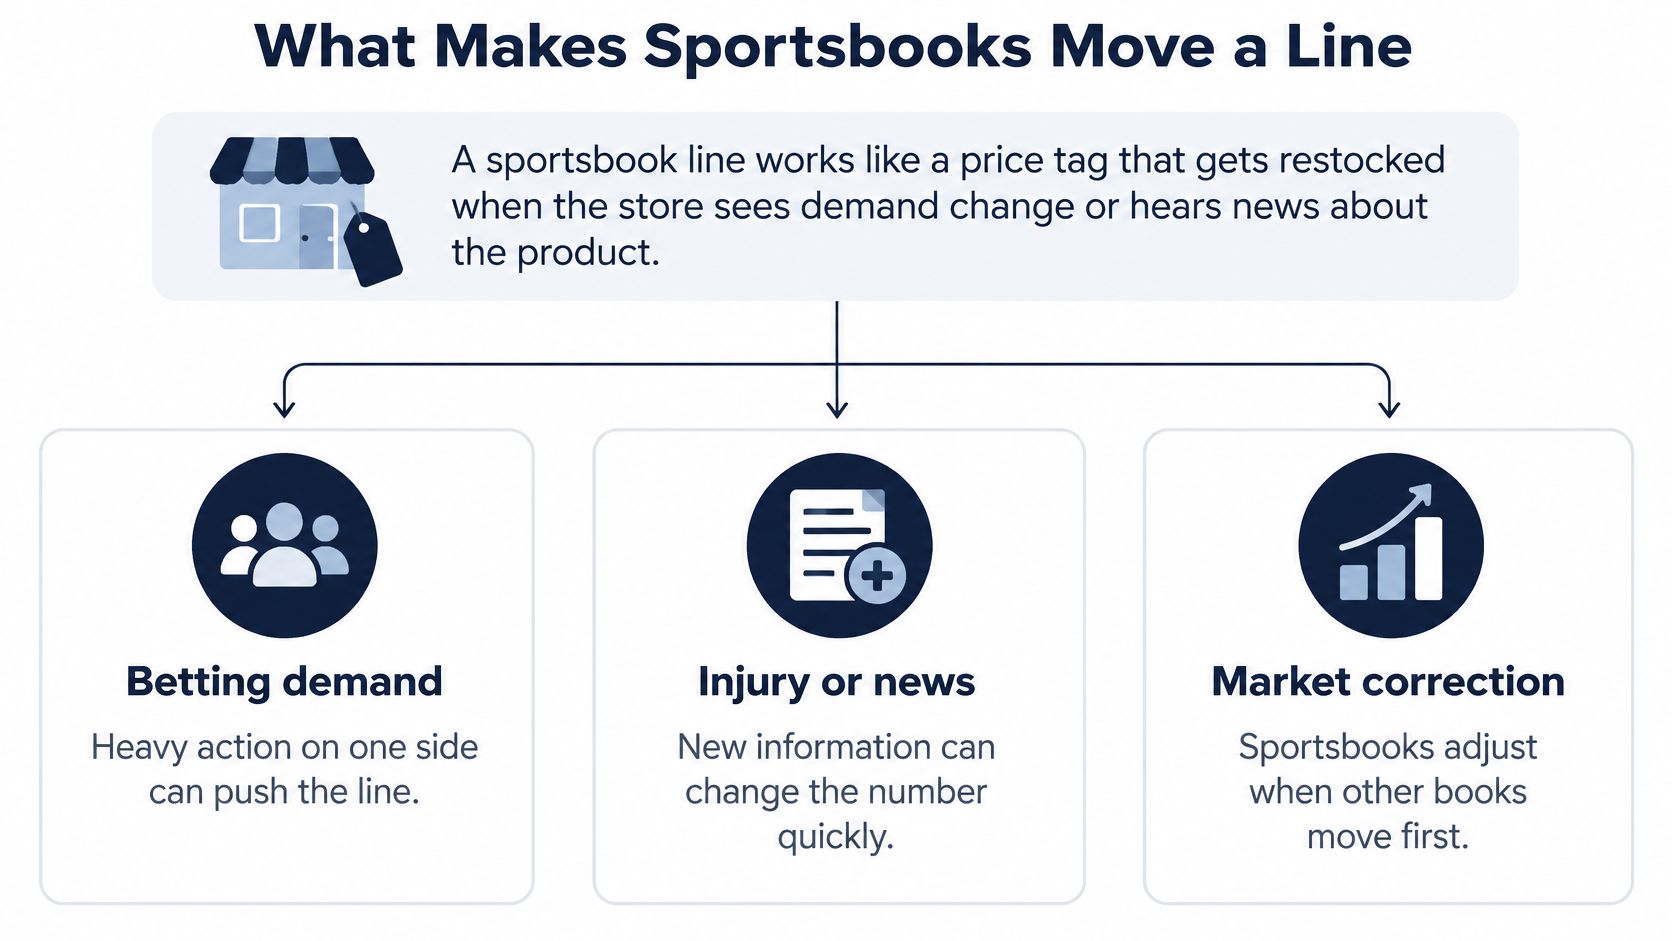
Follow the bookmaker's decisions
Say a book receives concentrated wagers on a favorite. Its traders could make that favorite less attractive to encourage wagers on the opponent and manage exposure. No injury announcement is necessary for that adjustment.
Now suppose confirmed availability news changes the traders' assessment of the matchup. They could move the spread even without receiving substantial wagers, because their estimate of fair value has changed.
A third scenario starts with a bettor whose action the book considers informative. The operator reacts, competitors observe the new number, and other books follow without receiving the original wager. What looks like widespread independent agreement could partly reflect operators responding to the same initial adjustment.
Visibility changes the interpretation
An analysis of 3,756 NFL regular-season and postseason games from 2007 through 2021 found more frequent and larger movements in lower-attention games. The authors propose capacity allocation as an explanation: bookmakers and market participants devote disproportionate analytical resources to prominent matchups.
That mechanism is an interpretation, not a diagnosis of every low-profile game. Still, it challenges the assumption that identical moves carry identical information.
A hypothetical one-point adjustment in a nationally televised game and the same adjustment in a low-profile matchup deserve different context checks. Ask how much attention the market has received, when the price was posted and whether confirmed information explains the change.
The number reveals the adjustment. It rarely reveals the cause by itself.
Steam, Reverse Movement and Other Common Patterns
Movement labels describe observable patterns, not proven causes. The LineSteam FAQ provides useful terminology for steam and reverse line movement, but recognizing a pattern doesn't establish that the remaining price offers value.
Movement patterns, drivers and what to verify
| Pattern | What it looks like | Likely driver | What to verify |
|---|---|---|---|
| Steam move | Rapid move of about 0.5 to 2 points across several books within 5 to 30 minutes | Sharp or syndicate money on one side that other books follow | Whether the move persisted or partly reversed |
| Reverse line movement | Line moves against the side receiving more tickets | Book adjusting exposure or new information | Whether news supports the move; treat direction as a check, not a mechanical rule |
| Single-book move | One book moves while others hold | Isolated adjustment or stale price | Whether other books follow within minutes |
| News-driven move | Move right after an injury, weather or lineup update | Change in the book's fair-value estimate | Whether the size of the move matches the news |
The steam range describes the textbook convention, not a threshold that certifies professional action. A copied adjustment can look broad even when the participating books haven't independently received informative wagers.
Reverse line movement requires particular restraint. Ticket counts describe the number of bets, not their size or informational quality, so moving against the more popular side isn't contradictory.
Test the path, not the label
The betting-market analysis indexed by EconPapers notes that following reverse line movement in NCAA football totals was generally unprofitable. That finding doesn't settle every sport or market, but it directly challenges a mechanical bet-against-the-tickets rule.
Consider a hypothetical favorite that moves a point and a half across several books, then gives back part of that move the next day. A screenshot taken immediately after the jump would support a different narrative from the full price history.
Neither snapshot tells you whether the original bettors were right. The retracement could reflect disagreement, a response to the new price or additional information.
Use three questions to replace the label-driven conclusion:
- Persistence: Did the adjustment hold after other operators had time to respond?
- Retracement: How much of the initial move disappeared?
- Confirmation: Does the timing match identifiable, confirmed news?
The useful output is a description of the path and remaining price, not an unsupported claim about who must know something.
When Late Movement Helps and When It Reverses
The assumption that late moves are always best doesn't survive close inspection. In a study of 3,681 MLB games across four sportsbooks, forecasts were generally reliable but didn't improve monotonically as game time approached; weekend day-game forecasts were significantly worse at game time than 90 minutes earlier.
The study also found negative autocorrelation in line changes. In plain English, an adjustment in one direction was often followed by movement back the other way, rather than uninterrupted progress toward a better forecast.
Use event-based windows
The early window runs from the opening market through the period before immediate pregame reactions. Build a baseline and attach explanations only when you can identify the information involved. A confirmed lineup or meaningful weather update gives you something testable, unlike an unattributed social-media explanation.
The reaction window begins when you observe a meaningful change. As a practical routine, watch the next half-hour to hour for follow-through or retracement, while recognizing that this isn't a validated universal waiting period.
The late window covers the remaining pregame market. Recheck availability, lineup confirmation and the actual price you can obtain, rather than treating proximity to game time as evidence of quality.
Compare two hypothetical explanations
Suppose a Saturday day-game price changes immediately after a confirmed lineup announcement. Your task is to update the affected assumptions and decide whether the new quote still differs from your estimate.
Contrast that with a late adjustment accompanied only by claims about public betting, followed by a reversal before first pitch. Without verified information, you can't confidently attribute either leg of that path to public money.
The distinction is explanation quality, not merely timing. A persistent move with identifiable information deserves a different assessment from an unexplained spike, but neither tells you to ignore the price.
Before chasing: If late movement is your reason for considering a wager, allow a reversal check before acting. An independently priced opportunity doesn't need movement to validate it.
Waiting can also cost you an available quote. Treat that trade-off explicitly rather than pretending either immediate action or delay is always superior.
Price Shifts That Cost You Without Moving the Spread
Say the spread stays unchanged while its price moves from -110 to -125, the example highlighted in the LineSteam discussion of actionable movement. The handicap looks identical, but the wager now requires a higher success rate to break even.
For negative American odds, calculate the break-even probability by dividing the odds' absolute value by that value plus one hundred. These are payout calculations, not observed performance statistics.
Break-even win rate by American price
| Price | Change from -110 |
|---|---|
| -110 | Baseline, about 52.4% required to break even |
| -120 | About 54.5%, an increase of about 2.2 percentage points |
| -125 | About 55.6%, an increase of about 3.2 percentage points |
The differences use unrounded calculations before rounding the displayed results. They describe the required win rate for resolved win-or-loss bets; pushes return the stake rather than producing a win or loss.
Compare probability, not screen space
The practical consequence is easy to miss: your projection hasn't improved merely because the book charges more. If your estimated chance of covering remains unchanged, the worse payout reduces the wager's estimated value.
Use a short price check:
- Convert the quote: Calculate the break-even probability at the currently available odds.
- Compare your estimate: Use the probability of winning this exact wager, not the team's moneyline win probability.
- Reject exhausted value: Pass if the updated payout no longer clears your required threshold.
Raw implied probability includes the sportsbook's margin. It's a break-even benchmark for that quote, not an independently established fair probability.
Removing margin from both sides can help describe the market's estimate, but that doesn't lower the payout hurdle on the wager you're placing. Compare your projection with the offered odds when calculating expected value.
Finally, check legal books before confirming the ticket. The relevant comparison is the same side, same spread and same rules at different prices, not a cheaper-looking price attached to a less favorable handicap.
Measuring Closing Line Value Across Books
Closing line value, or CLV, evaluates your entry against the final pregame market rather than the game's result. An academic manuscript on opening and closing prices supports closing prices as a useful forecasting benchmark while finding that larger relative movements were less accurate on average.
Record the comparison consistently
- Save your actual ticket: Record the side, number, price, sportsbook and acceptance time.
- Capture the closing quote for that exact wager, using a predetermined book or consistent cross-book benchmark.
- Convert matching prices: For the hypothetical unchanged-spread example above, calculate each quote's implied probability.
- Subtract entry implied probability from closing implied probability. The illustrative entry beats the close by about 3.2 percentage points before margin removal.
- Aggregate comparable wagers: Compare the average with zero, while keeping sports and market types separate.
Keep spread-point changes in a different column from price changes. When the handicap changes, the wagers aren't identical, and a probability difference requires additional modeling rather than simple odds conversion.
A favorable close measures entry quality against a benchmark. It doesn't certify a winning bet or prove a durable edge.
Log the checked news beside each entry so you can investigate whether favorable timing came from identifiable information or unexplained price variation.
Check Movement Against Your Own Number Before You Bet
Before placing a wager, compare the available price with your projected probability. Movement can change your assumptions or your entry opportunity, but it shouldn't replace the probability estimate.
Keep the decision tied to the actual market you're evaluating.
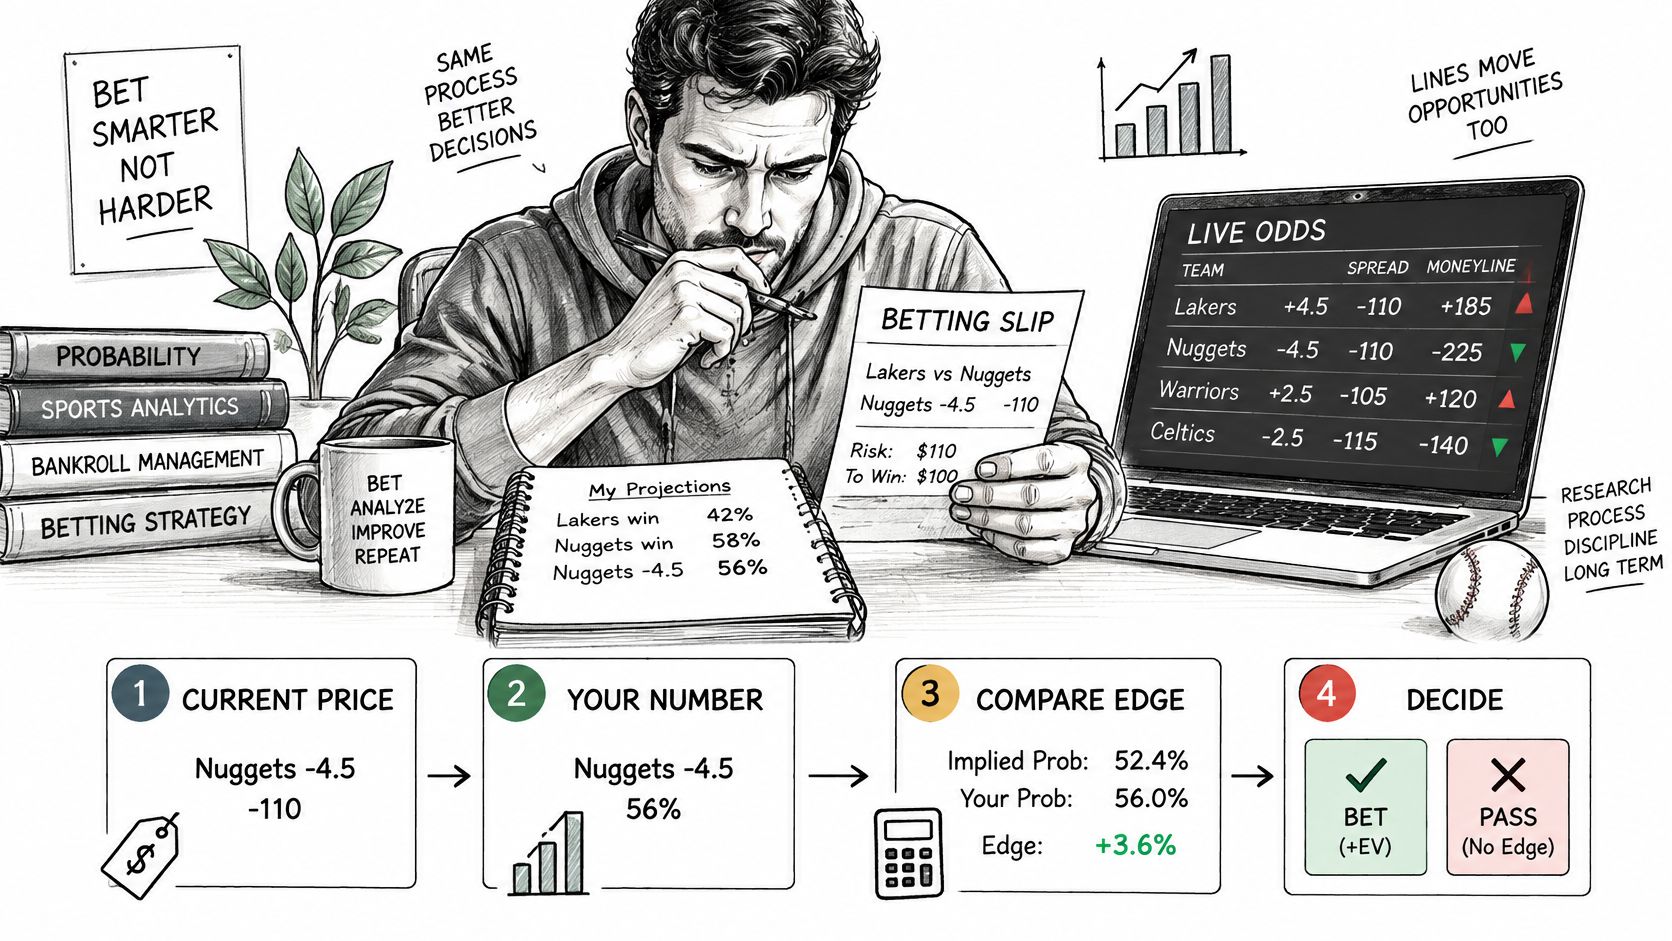
Make the decision in order
Estimate before following the crowd. Establish your probability for the selected side and exact handicap. Record the assumptions so you can distinguish a genuine model update from a reaction to the odds screen.
Convert the current price into its break-even probability. Remove margin when comparing market estimates, but retain the offered payout in your expected-value calculation.
Classify the observed path. Note whether the adjustment held, retraced or remained isolated. Missing history should reduce confidence in your interpretation, not invite a confident narrative.
Check the proposed explanation against confirmed news. An announcement can justify updating your projection without justifying the entire size of the sportsbook's adjustment.
Pass or pause when appropriate. If the available quote no longer meets your threshold, pass. If your case depends on an unexplained move, wait for a follow-up observation instead of manufacturing certainty.
An academic study of MLB betting markets found favorable odds movement in approximately 50.64% of games across its full sample. That's close to half of observations, not evidence that a single move reliably identifies a future winning wager.
Use the same price-and-probability discipline when reviewing betting explanations on video.
Keep betting and DFS decisions distinct
For DraftKings and FanDuel DFS, use confirmed news to reassess player roles, floor/ceiling, stacking and projected ownership. Don't automatically turn a moving total into a GPP stack, or assume a favored team supplies the best cash games plays; salary, correlation and contest structure remain separate decisions.
With late swap, revisit eligible positions without treating already-started players as movable. The useful connection is the underlying information, not a rule that a sportsbook adjustment dictates a fantasy lineup.
For a consolidated betting comparison, our sports betting analytics cover moneylines, spreads, totals and alternate lines, showing movement since open, implied probability with margin removed, projected probability and an expected value indicator. We compare betting markets and player props across eight sportsbooks, and one subscription covers all 12 sports.
Projections, simulations and picks are estimates, not guarantees. StatWarrior doesn't take wagers or contest entries, and source data can contain errors or delays.
Bet only where legal and follow our responsible-play guidance. Set limits you can afford, don't chase losses, and contact the National Problem Gambling Helpline at 1-800-MY-RESET (1-800-697-3738) if you have a gambling problem.
StatWarrior brings market comparisons, projected probabilities and line movement into the same analysis workflow. Visit StatWarrior to compare the available price with your estimate and evaluate whether a move still leaves a wager worth considering.
Made with the Outrank app