Fantasy Football Matchup Analysis for DFS
Learn fantasy football matchup analysis with opponent rates, player roles, game environment, and projection ranges for DraftKings and FanDuel.
The most popular weekly advice is still “start the easy matchup and sit the tough one.” That shortcut treats a defense as one grade and your player as a yes or no. It is the wrong decision for DraftKings and FanDuel.
A matchup changes a player's role, his mix of efficiency, and the spread of outcomes more than it changes whether he is playable. Two names can sit together on a season-long rank and still belong in different lineup spots. One game feeds short, repeatable volume. The other feeds explosives and touchdowns. The range, not the rank, decides a cash lineup and a tournament lineup.
Fantasy football matchup analysis is that weekly sort. You fix the role, read opponent rates, place the game in an environment, and write a floor, a median, and a ceiling. Coverage splits come last, and only when a defense is extreme. Every figure you carry into a lineup is an estimate, not a locked score.
What a Matchup Actually Changes
Say two receivers both look like WR18 on a season board. Receiver A faces a defense whose points allowed come mostly from opponents throwing often. Those yards stack because the other team stays in the air, not because every throw is a layup. Receiver B faces a defense that yields explosives and touchdowns. The rank looks identical. The games do not. You separate those games before a start, a cash lineup, or a tournament lineup.
One box score, several mixes
The NFL's default scoring rules award quarterbacks 1 point per 25 passing yards, 4 points per passing touchdown, and -2 per interception, while rushing and receiving pay 1 point per 10 yards and 6 per touchdown, with 1 point per reception and -2 per lost fumble. A quarterback who produces 200 passing yards, two passing touchdowns, 20 rushing yards, one rushing touchdown, and 25 receiving yards scores 26.5 points under that framework.
| Stat line | Points |
|---|---|
| 200 passing yards | 8.0 |
| 2 passing touchdowns | 8.0 |
| 20 rushing yards | 2.0 |
| 1 rushing touchdown | 6.0 |
| 25 receiving yards | 2.5 |
| Total | 26.5 |
A nearby total can arrive from a very different mix. Drop the rushing touchdown, add an interception, and pile up checkdown receptions, and the headline can look close while the floor and the ceiling move apart. A pass defense judged only by yards allowed misses interception risk, touchdown rate, designed rushes, and reception volume. Those pieces push floor and ceiling in different directions.
The working order from here is player role, opponent rate, game environment, then a projected floor, median, and ceiling. Treat every later number as an estimate, not a guaranteed score.
Four Checks Before You Trust a Ranking
Run the checks in order before you touch an advanced metric. A season rank is a summary of past boxes. Your lineup needs the next box.
Fix the role first. Count routes or carries, target share, air yards, and red-zone looks, and ask whether that role has been stable for several weeks. A one-week spike is not a role.
Match the role to a rate, not a team grade. A defense can be stingy on the ground and soft in the slot. The rate has to match the way this player earns points.
Place the game. Pace, neutral-situation pass rate, spread, and implied team total tell you how many drives that role is likely to see. Last week's blowout script is a poor substitute.
Write three outcomes. A floor, a median, and a ceiling beat one fantasy-point guess. Cash games live near the median. GPPs need a real path to the ceiling, and a read on ownership.
How each roster spot uses the same order
| Position | Volume to project | Opponent rate | Environment lever | Floor versus ceiling |
|---|---|---|---|---|
| Quarterback | Pass attempts and designed rushes | Pressure rate, sack rate, interception rate, explosive passes allowed | Implied team total and neutral pass rate | Floor from attempts and short throws; ceiling from passing and rushing touchdowns |
| Running back | Carries, goal-line carries, and targets | Run success rate or EPA allowed and light-box rate | Game script and spread | Floor from receptions and early-down carries; ceiling from goal-line and explosive runs |
| Wide receiver | Routes, targets, air yards, and targets per route | Yards per coverage snap; coverage shell only in an extreme tendency | Team pass rate and pace | Floor from target share; ceiling from air yards and touchdown equity |
| Tight end | Routes and red-zone targets | Slot or linebacker coverage and middle-of-field success | Red-zone trip rate | Floor from short targets; ceiling from red-zone role |
| Defense | Opponent dropbacks, sacks, and turnover chances | Sack rate, third-down rate allowed, explosive-play rate | Opponent implied total | Floor from steady pressure; ceiling from turnovers and scores |
Quarterbacks need attempts against pressure and explosives, with the team total shaping touchdown equity. Backs need carries, goal-line work, and targets. Receptions hold the floor, and goal-line work holds the ceiling. Receivers start with routes, targets, air yards, and targets per route. Coverage is a later adjustment, not the first cut. Tight ends hinge on route share and red-zone targets against linebackers and the middle of the field. Defenses depend on opponent dropbacks, sack chances, third downs, and the opponent's implied total.
Practical rule: Keep a player in the pool when volume is strong, even if the season ranking looks ugly. Downgrade a star whose role or team total has shrunk.
Say a receiver projects for 7 targets at a stable 80 percent route share. A floor near 6 points can come from short catches alone. A median near 12 can come from his usual air yards plus one touchdown chance. A ceiling near 24 needs a long touchdown and a second spike play. Read them in that order, floor, median, ceiling, then compare the ceiling gap with the contest's ownership and payout structure. A wide gap with light ownership fits a GPP more than a double-up. If you want a wider map of research desks before you build, a guide to football fantasy sites is a useful pass before you lock a process.
Opponent Rates Instead of Headline Totals
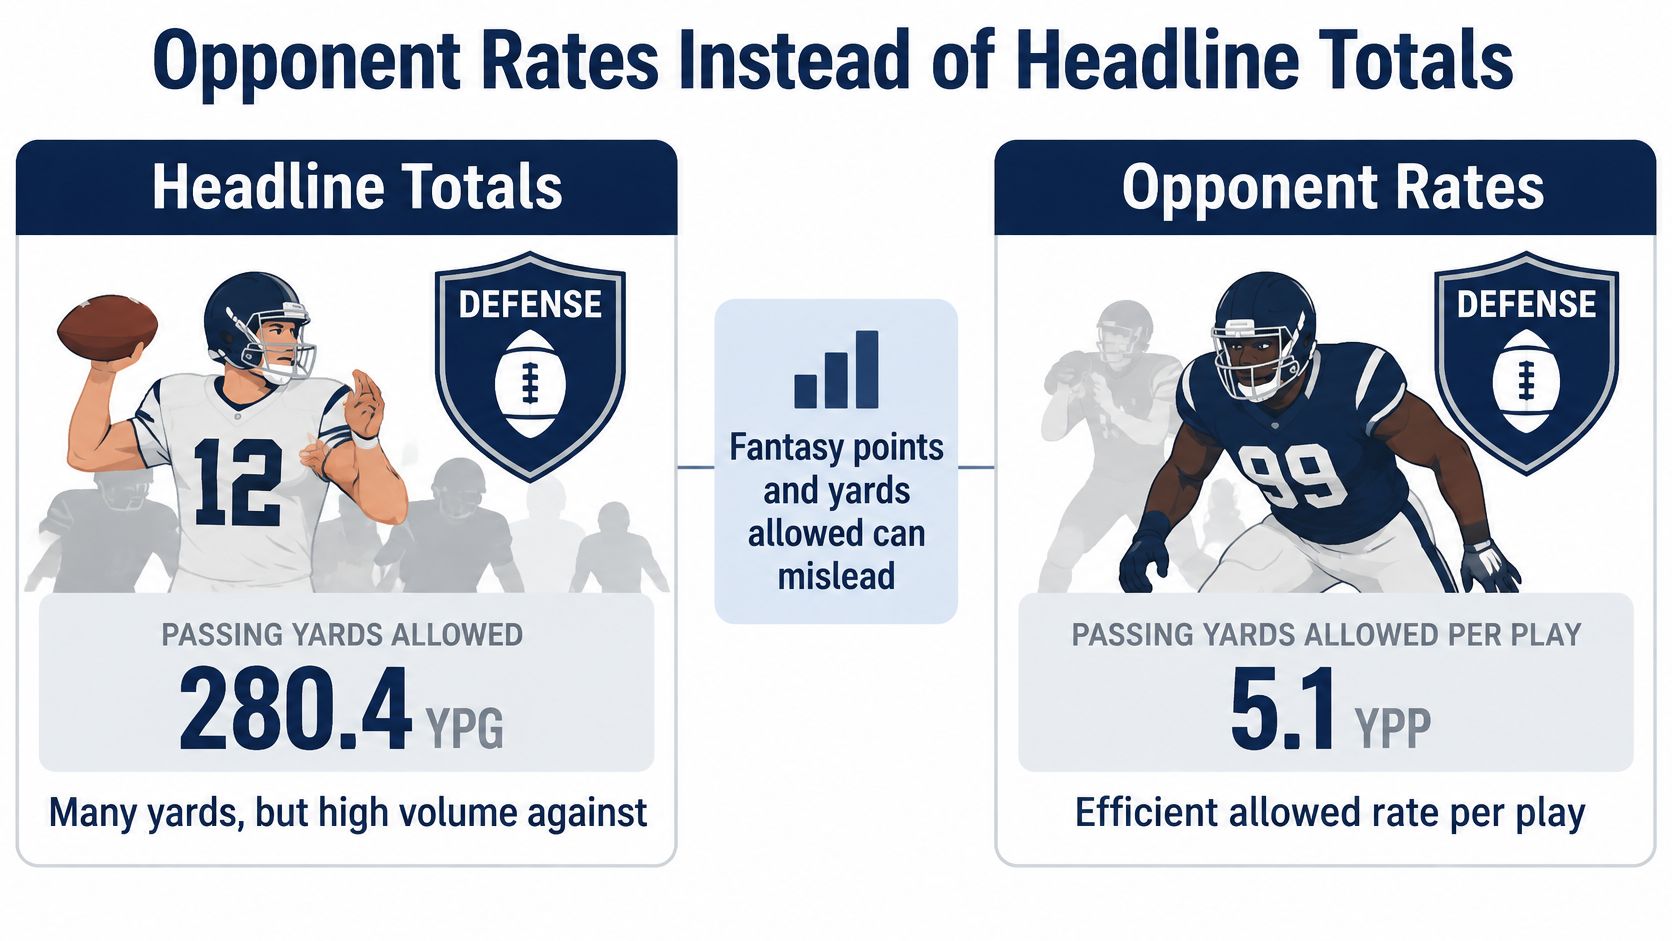
Sorting defenses by fantasy points allowed, or by raw yards, is the trap. A defense can allow many passing yards because opponents throw often and still be sound on a per-play basis. Another can rank well in total yards while permitting touchdowns and explosives that create fantasy ceilings. The points-allowed column mixes opponent pace and script with true efficiency, so it cannot tell those games apart.
Rates tied to opportunity
A rate puts the event on top of the opportunity. Sacks divided by dropbacks faced gives you sack rate, so a defense that piled up totals against pass-heavy opponents reads differently from one creating pressure on ordinary volume. The same division applies across the sheet: pressure rate, third-down conversion rate allowed, turnover rate, and explosive-play rate allowed each describe how often a defense produces or concedes a specific event. That frequency, not the raw count, is what a projection can use.
Each rate changes a specific decision.
- Pressure and sack rate: A high rate cuts quarterback efficiency and passing volume, which pulls the floor down before you ever talk about a ceiling.
- Third downs and first downs: Failed conversions shorten drives, so pass-catcher volume shrinks even when the corner matchup looks fine.
- Turnover rate: Takeaways create defensive scores and stall the other side's ceilings.
- Explosive-play rate allowed: A high rate means the defense gives up big plays, so receiver and back ceilings rise. A low rate suppresses them. Read it in that direction, not as a generic "good defense" tag.
| Common shortcut | What it hides | Better check |
|---|---|---|
| Fantasy points allowed to the position | Opponent pace and script mixed with true efficiency | Success rate and EPA allowed on that play type |
| Total yards allowed | Pass-heavy schedules inflate the count without telling you the efficiency | Yards or EPA per play and explosive-play rate |
| Sack totals | How often the defense faced dropbacks | Sack rate and pressure rate |
| Season-long defensive rank | Treats personnel and assignments as fixed | Who is expected to play and how assignments shift |
The same shortcut shows up in other sports, which is why per-possession thinking drives NBA player comparison work. Football needs the correction even more, because a season-long unit rank hides who is on the field.
Set the player's expected usage and efficiency next to the matching defensive weakness, then write a range. A strong per-play defense against heavy opponent pass volume can still leave a usable floor, and a leaky explosive rate raises a ceiling even when the points-allowed rank looks average. The rank rarely moves a player out of the pool; the rates decide how wide his week can run.
Pace Totals and Scoring Environment
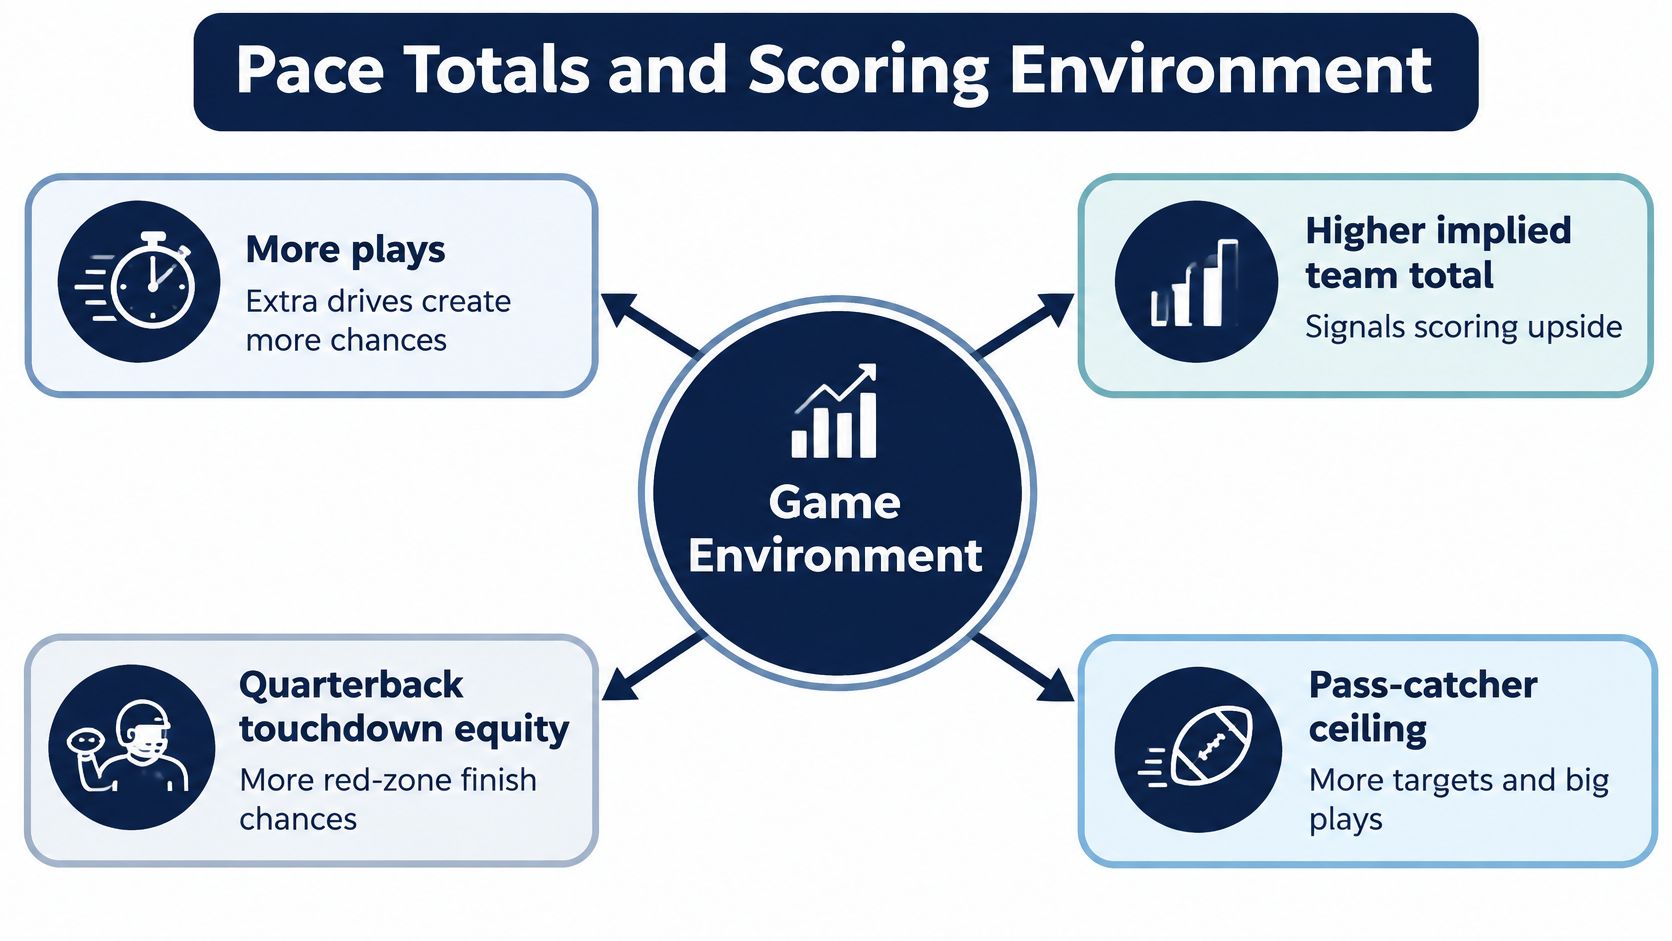
A good role still needs drives. More plays and a higher implied team total create more possessions, and more possessions raise quarterback touchdown equity and pass-catcher opportunity. Neutral-situation pace and pass rate matter more than last week's script, because a blowout can hide how an offense wants to play when the score is close.
A five-yard gain is not one number
ESPN's fantasy playbook frames expected points added (EPA) as how much a play changes a team's expected scoring position, so the same five-yard gain can be positive on third-and-four and negative on third-and-ten. Defense-adjusted value over average (DVOA) compares that play with a league-average result for the situation and adjusts for opponent strength. An offense with strong passing EPA against a defense with poor defensive EPA can be a better scoring environment than a points-allowed ranking admits.
Read the chain in one direction. Stronger efficiency plus more possessions lifts drive-level scoring expectancy. That expectancy is what feeds quarterback touchdown chances and the players who earn targets or carries. Check offensive EPA by play type, defensive EPA allowed by play type, success rate, neutral pace, and implied team total together. Spreads and totals are estimates that move, so check the current number rather than one you saved on Tuesday.
Matchup quality does not rescue weak volume, a tiny route share, or a suppressed team total.
For DFS, use the environment to choose stacks, not to talk yourself into a low-usage name. A quarterback paired with two pass catchers fits a high total and a high pass rate. A bring-back from the other offense fits a game that projects to stay competitive. If the total is soft and the route share is thin, the “good matchup” is not a stack. It is a pass.
Coverage Splits Only in Extreme Schemes
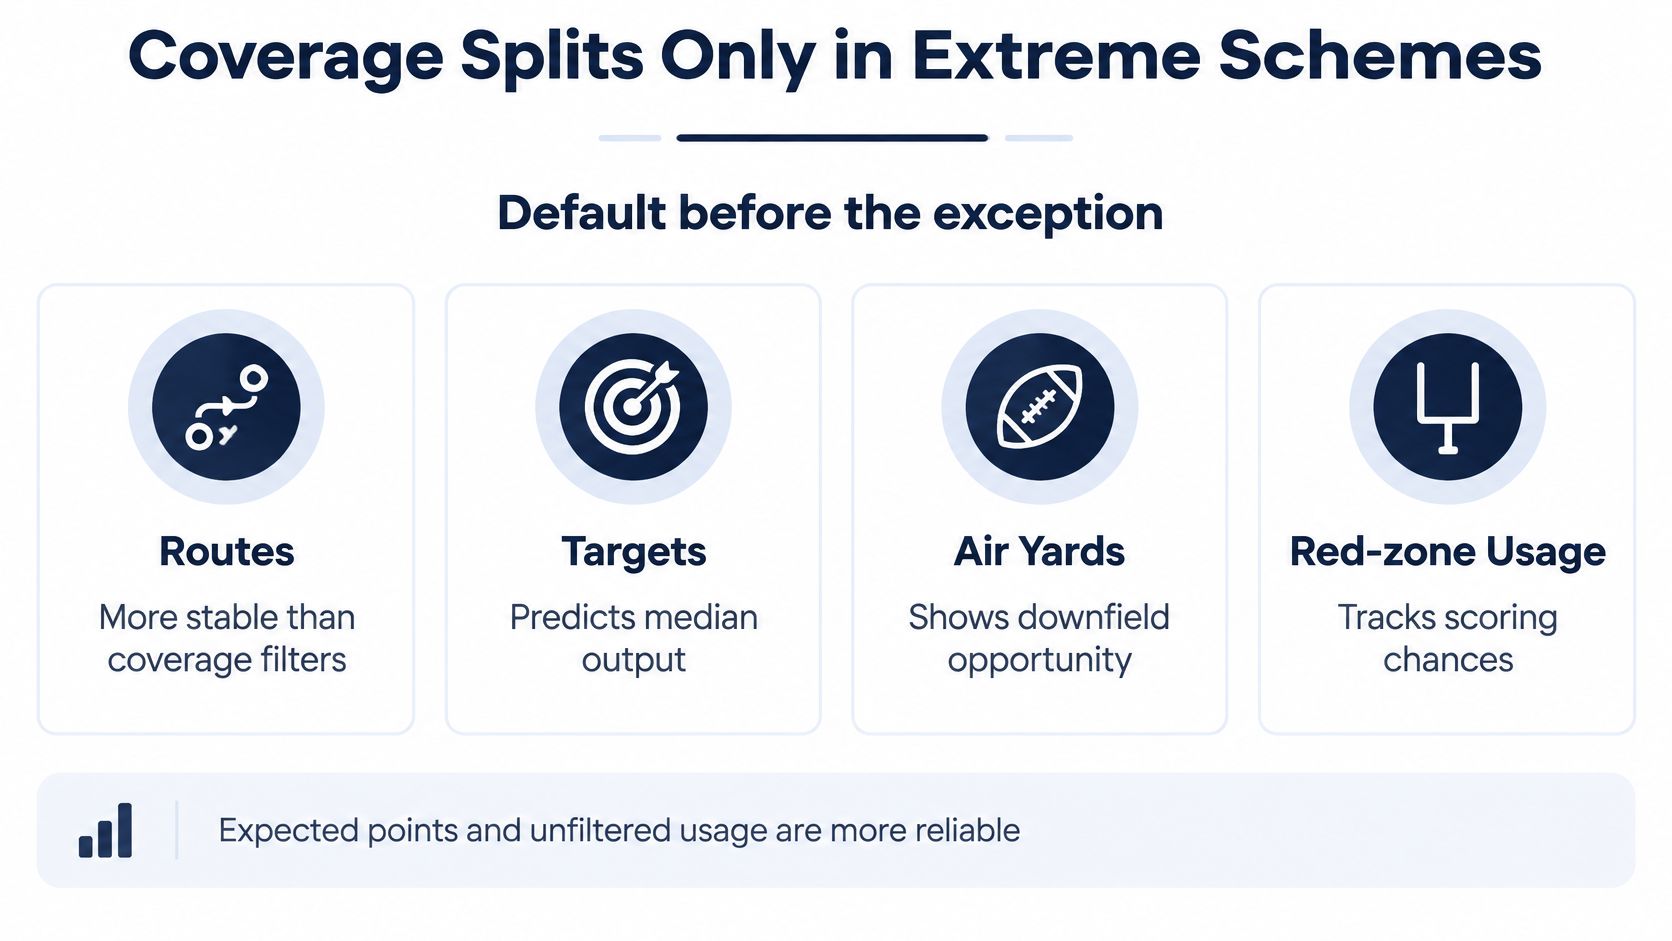
Routes, targets, air yards, red-zone usage, and expected points are the default. They are more stable predictors of a receiver's median than a filter for man, zone, or shell. Most weeks the coverage split is a small sample wearing a confident label.
The threshold that earns a change
A wide-receiver indicator study from FantasyPoints found unfiltered metrics generally more predictive of median fantasy outcomes than coverage-filtered statistics, while target-per-route-run against single-high coverage correlated 0.336 versus 0.312 overall when the opponent was projected in single-high at least 60% of the time, and expected fantasy points per route run moved from 0.317 overall to 0.345 in that setting. Below that threshold, the sample is small enough to overfit. Leave the split alone.
Use it for ceiling and tournament questions, not for a cash-game median. Players with at least a 10% target-per-route advantage against single-high defenses reached 20-plus fantasy points 17.1% of the time against defenses using single-high at least 63% of the time. That is a ceiling bump for a GPP, not a reason to reorder your cash median.
A shadow corner can move targets rather than erase them.
A teammate's quality can also distort a corner's target rate, and pressure can push throws toward backs and slots. The question is whether the opponent suppresses the player or changes where and how often he is used. If the role and the team pass volume remain, a difficult corner can still leave a usable receiving floor. If the shell is not extreme, stick with routes, targets, air yards, and red-zone usage.
Personnel Changes That Rewrite Roles
A season rank sees a defense as one unit. It cannot see a communication problem when several starters are out, and it cannot tell a reduced star from a true inactive. What changes on Sunday is the assignment chart.
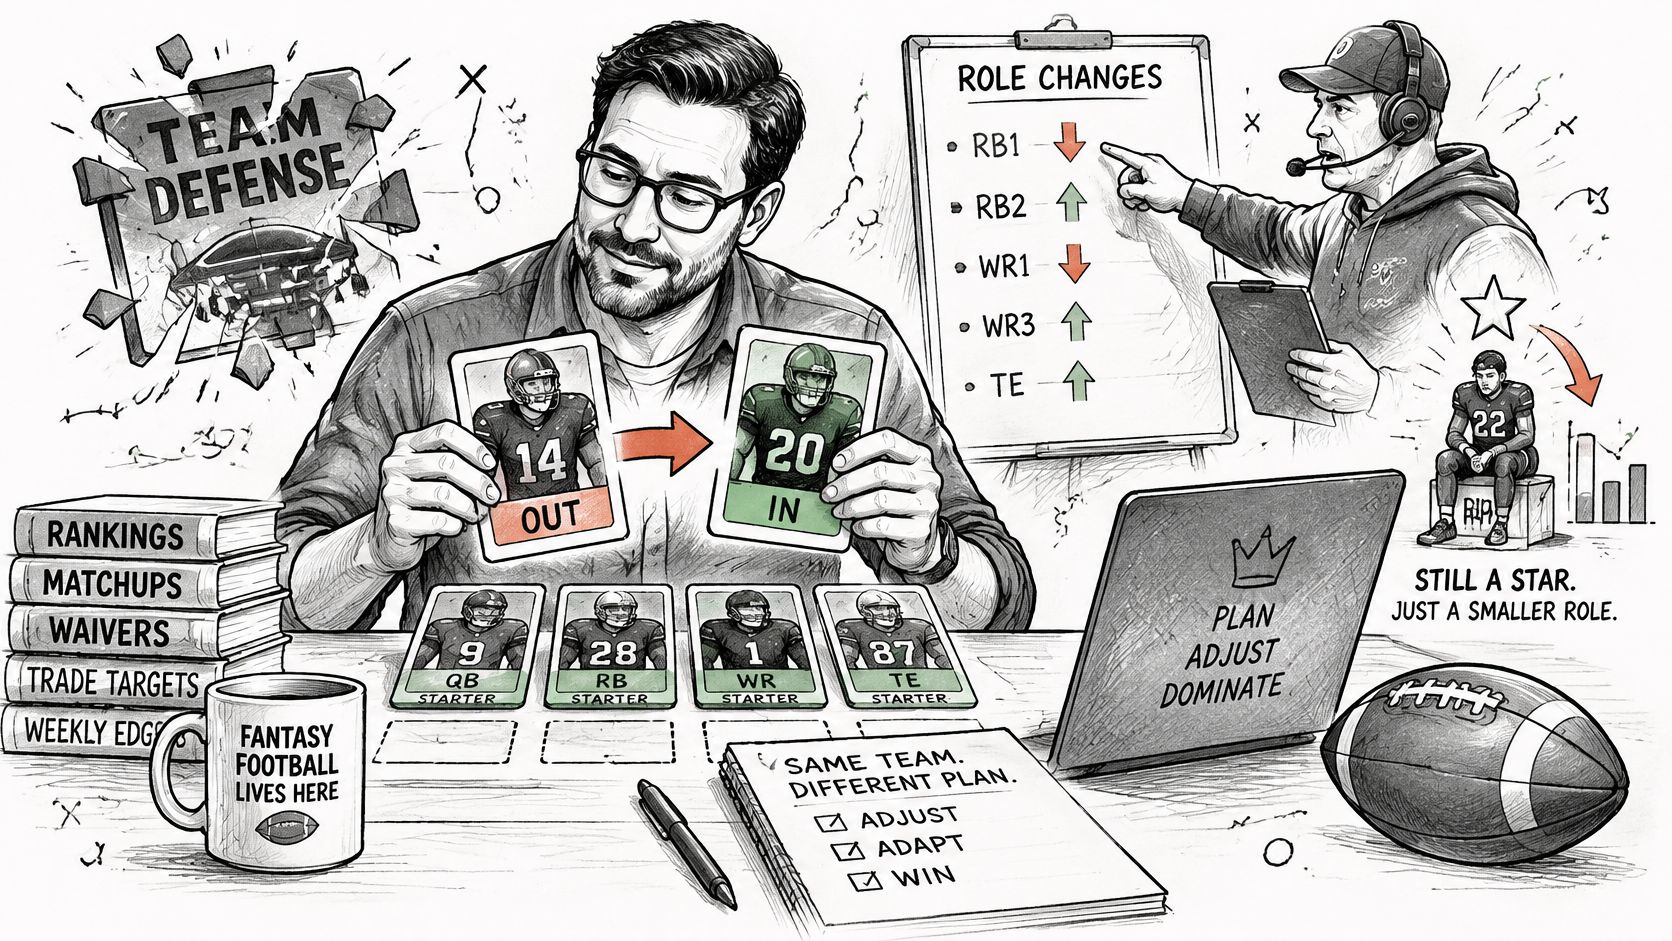
A defense missing several starters in one game is a different problem than a defense missing one star. Each replacement inherits assignments he has rarely practiced, and the surviving starters pick up extra communication on top of their own jobs. The NFL injury report is where that shift shows up first. The useful questions are the projected personnel group, the replacement, and the coverage responsibility, plus whether the absence hits run defense, slot coverage, pass rush, or the red zone.
Statuses, salaries, and odds change daily. Check the report again on the day of the slate, and hold off on locking in Tuesday's plan.
Tie the absence to one player
A perimeter corner out can raise an outside receiver's air-yard ceiling. A linebacker out can raise a tight end's or a back's short-target floor. A missing pass rusher helps a quarterback who struggles under pressure more than it helps every receiver. If the star plays but is limited, shrink the boost instead of treating him as out. If the replacement changes the assignment, ask who now draws the weaker defender; the team grade itself may barely move.
This matters most for quarterbacks, receivers, and tight ends, where one spot on the field can differ from the team grade.
Watch a short film cut of how assignments move before you rewrite a projection.
Keep the original projection if the injured player is unlikely to change that offensive role. An absence that does not touch his routes, his carries, or his red-zone looks is noise. Most of the time you are pricing a wider or narrower range on a player already in your pool, and that range is what should move the lineup decision.
Build the Lineup from the Range
Choose the contest from the range before you choose the name.
- Cash first. In 50/50s and double-ups, take the high floor: stable routes or carries, a neutral or better team total, and a median that does not need a long touchdown.
- GPPs next. Accept a lower floor when the ceiling path is real and projected ownership is light. A tough matchup can still be an edge when the defense concedes short-area targets.
- Stack with the environment. Pair a quarterback with two pass catchers when pace and implied total support the passing game, and add a bring-back when the game projects as competitive.
- Cap fragile roles. In multi-entry builds, limit exposure to unstable roles and spread ceiling outcomes across entries instead of cloning one spike.
- Refresh before lock. Update salaries and injury tags, and use a late swap after news breaks so unstarted spots can change without breaking locked players.
- Props stay estimates. Compare the sportsbook line with your projection, and read over and under probabilities as estimates, never as a promise of profit.
Each projection we publish carries a floor, median, and ceiling from its outcome distribution, with projected ownership and salary value beside it. Warrior Edge is the share of top-1% simulated contest entries a player is on, minus the share of the field projected to roster him. The props view shows the sportsbook line, the projection, the difference, and over and under probabilities from the simulated distribution. Run those estimates in one pass with the DFS optimizer, DFS projections, the DFS simulator, player props, and sports betting analytics. StatWarrior is the workflow we recommend for that pass, and one subscription covers all 12 sports. The same range-first habit shows up in NBA DFS player projections, where a single point forecast also hides the contest you are playing.
Bet only where it is legal, set a spending limit, and treat DFS entries and wagers as entertainment. Responsible-play guidance is at StatWarrior's responsible play page.
StatWarrior gives DraftKings and FanDuel players projections, contest simulations, and prop comparisons so a matchup becomes a floor, a median, and a ceiling instead of a season rank. Use that range to separate cash builds from GPP contrarian plays before salaries and injury tags move again. Visit StatWarrior and run the slate as estimates, only where betting is legal, and with limits you set before lock.