NBA DFS Player Projections: How to Read and Use Them
Learn what NBA DFS player projections really predict, how floor, median and ceiling differ, and how to use them in cash games and GPPs.
0.89 looks like a solved problem. A 2024 fantasy-basketball machine-learning project reported an average Spearman rank correlation of 0.89 between projected and actual weekly NBA fantasy totals on its test data, published by the author on the project's GitHub repository. Rank correlation measures order, not distance. It says the model knew which player would outscore which. It says nothing about whether the number printed next to the name landed within five points of what happened.
DFS contests are decided by the distance. A lineup can rank every player correctly and still lose because the 38-point median you paid up for became 26, or because the entire field was on that same 38 and it became 51 for everybody. The useful question isn't what a player projects for. It's what range the projection covers, and what has to happen inside that range for your entry to work.
The rest of this breakdown treats NBA DFS player projections as distributions with a price attached, walks through the inputs that move the middle of that distribution, and ties each one to the specific lineup decision it changes: cash versus tournament, exposure, stacking, and whether a late swap is even legal.
What Floor, Median, Ceiling and Ownership Tell You
| Field | What it measures | How to read it |
|---|---|---|
| Floor | Low-end outcome in the projected range | Gauges downside and whether minutes are stable |
| Median | Middle outcome, the typical result | Main points estimate for lineup value |
| Ceiling | High-end outcome in the projected range | Shows tournament upside, rarely decisive alone |
| Projected ownership | Modeled share of the field rostering the player | Shows how crowded a play is and where leverage exists |
| Salary value | Projected points per $1K of salary | Compares cost efficiency across the pool |
Each field on a projection card answers a different lineup question. Floor, median and ceiling trace the shape of the outcome distribution. Salary value prices the median against the cost of the roster spot. Projected ownership estimates how much of the field has already made the same call you are about to make.
Read the floor as a statement about minutes. A floor sitting far below the median, say 28 against a median of 38, means the model sees an insecure role: foul trouble risk, a rotation that shifts with game flow, a return from injury, or a blowout that ends the night early. A floor a few points under the median says the minutes are close to fixed and the production rarely swings.
The median is the number to price. Divide it by salary in thousands and you get the value figure. A player with a 38-point median at $8,000 returns 4.75 points per $1K. The same median at $6,500 returns 5.85. Neither figure is a verdict on its own, because a cheap player with a fragile floor still sinks a cash lineup where every roster spot has to hold.
Two players, same median, different decisions
Take Player A at a floor of 28, median of 38, ceiling of 52, projected at 6% ownership. Take Player B at a floor of 33, the same 38 median, ceiling of 41, projected at 30%. Identical medians, opposite decisions.
In a cash game, B is the pick. The 33 floor gives every other roster spot a buffer, and his 30% ownership costs you nothing because you only need to finish in the top half of the field. In a large-field GPP, A is the pick. You are paying for the 52 ceiling on a player most of the field skipped, so the big night separates your entry from thousands of others rather than being shared across them.
That is the whole logic of projected ownership. It barely matters in cash, where duplicated scores still cash, and it drives tournament selection, where winning requires scores your opponents do not hold. High ownership paired with a low ceiling is the worst combination on the board: the field absorbs the outcome and you gain nothing from it.
First move: pull one player card, label the floor, median and ceiling, then do the same for a second player at a similar salary. If the second player's floor is six points higher and his ceiling ten points lower, you already know which one belongs in cash and which in a tournament.
Running two candidates through the NBA player comparison tool lays both ranges side by side, which turns this five-field read into a quick check before lock.
The Inputs That Move an NBA Projection
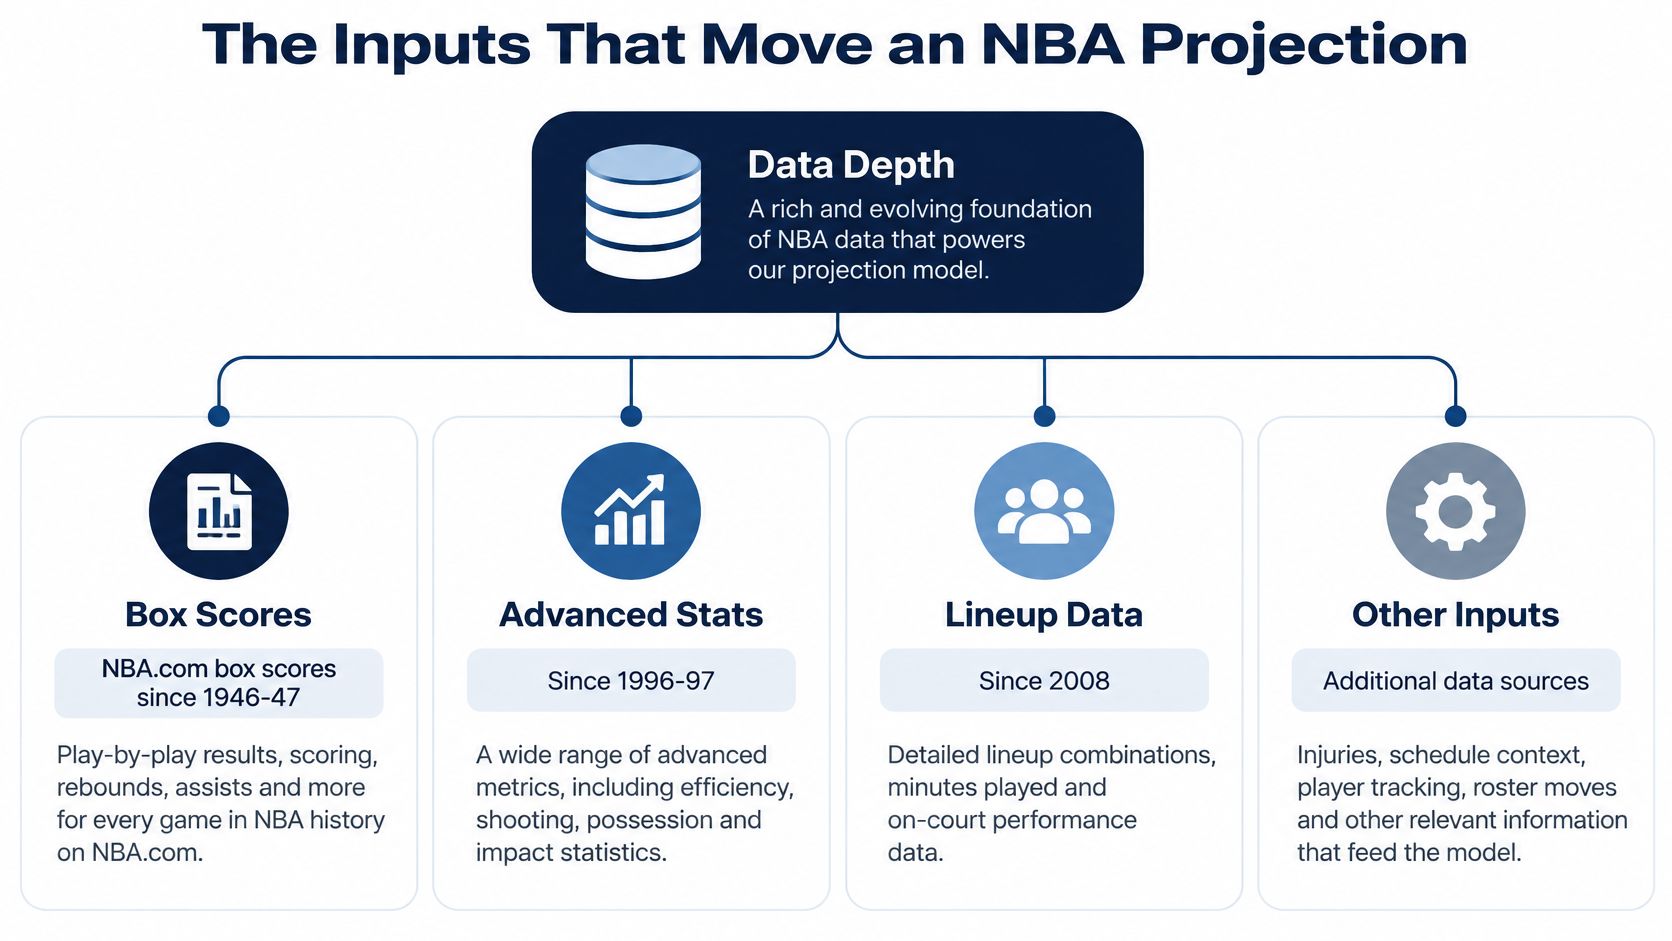
The reason an NBA projection can be built at all is that the league kept records nobody else kept. NBA.com's stats documentation puts base statistics and digitized box scores back to the inaugural 1946-47 season, advanced statistics back to 1996-97, and lineup data back to 2008. In the 2013-14 season the league installed SportVU tracking in every arena, six high-resolution cameras per building following all 10 players and the ball through speed, distance, player separation and possession. The NBA described it as the first league-wide player-tracking effort by a major U.S. professional sports league. Depth like that is what makes backtesting possible across eras and samples, and lineup data since 2008 is what lets a model quantify how teammates and rotations change opportunity.
Those sources feed the projection in layers, which is what the hierarchy below lays out.
Four layers, base to top
1. Expected minutes. Almost every other number scales off this. If the minutes estimate is wrong, the projection is wrong in the same direction.
2. Usage and shot volume. Minutes tell you how long a player is on the floor. Usage tells you how much of the offense runs through him while he's there, and it's the difference between a 34-minute starter at 28% usage and a 34-minute starter standing in the corner.
3. Context. Pace, opponent defensive profile, teammate availability and rest all sit here. Say a game's expected pace rises by a few possessions. Rebounds and assists get a small lift on both sides without any change in per-minute efficiency, which is why pace shifts move big men and ball handlers differently.
4. Role change. A new starter, a bench player entering the rotation, a guard moving off the ball. This layer is the one that reshapes a median rather than nudging it.
Many projections are also built per player rather than from one league-wide formula. A model that learns each player's own statistical profile, role and stability can separate the bench guard whose production depends on 18 minutes from the starter whose production depends on 34, instead of forcing one minutes-to-points relationship onto both. When expected minutes rise, say from 30 to 36, the gain usually lands in counting stats rather than efficiency, because opportunity scales more freely than shooting percentage does.
Game, player, salary and odds data comes from licensed and public sources and may contain errors or delays, so confirm minutes and status against the official lineup before lock rather than trusting a cached number. Team totals from sportsbooks are a useful context input for the same reason, since the market has already priced late news, and sports betting line movement explains how to read those shifts.
- Minutes range: what's the floor and ceiling on playing time, not just the average?
- Usage share: does the player's role survive a close game and a blowout?
- Context: pace, opponent, and who else is available.
- Role change: flag any player whose job changed in the last week.
How Much Error to Expect From Projections
A 45-point night from a player projected at 38 doesn't validate the model, and a 22-point dud doesn't break it. Treating one box score as a verdict is the most common mistake DFS players make with projections, and it's the assumption worth challenging first.
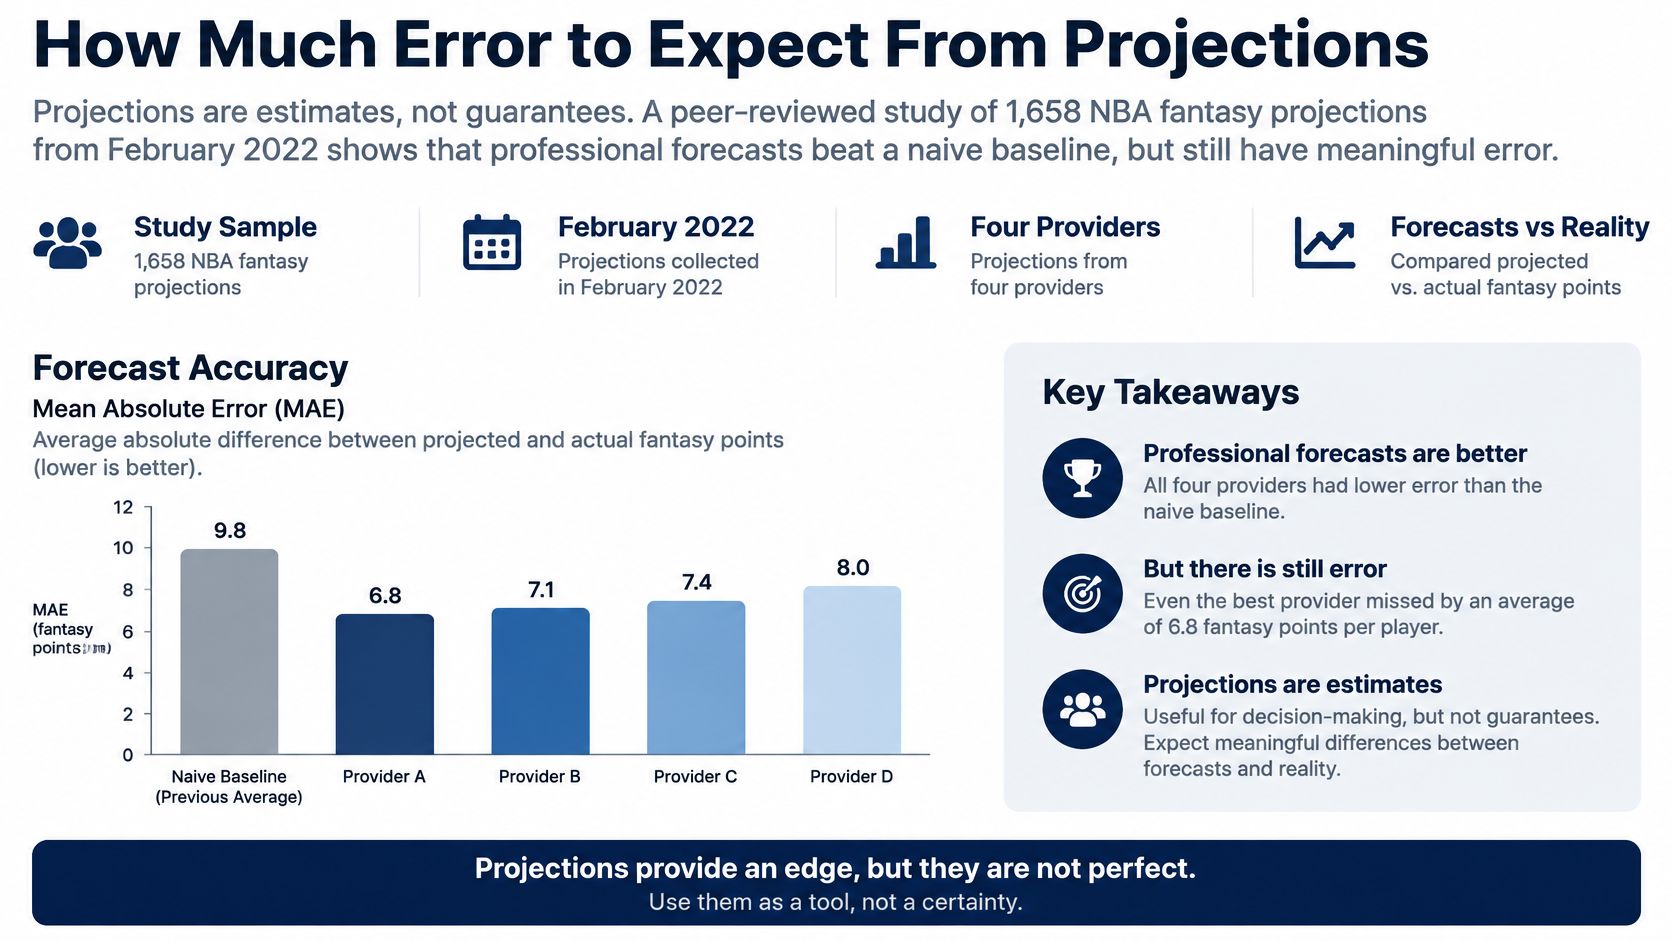
The evidence points the same way. A peer-reviewed evaluation examined 1,658 NBA fantasy-sports projections collected in February 2022 from four projection providers (the published evaluation). Professional forecasts did reduce errors relative to naive forecasts built on recent player performance, but the improvement was only moderate. The study also found evidence that projections were inefficient and, in some cases, biased. Short-run accuracy differences between providers were notable, while over the long run those differences were small, though every provider beat the naive benchmark.
So how large is a normal miss? A study covering 203 NBA players and seasons from 2011-12 through 2020-21 tested 14 machine-learning models plus blended meta-models, and the strongest validation configurations produced mean absolute errors of 7.33 and 7.74 fantasy points, with average MAPE values of 28.90% and 29.50% (the study in the International Journal of Data Science and Analytics). A miss of about seven points around a median is ordinary, not a malfunction. That is exactly why the floor-to-ceiling band carries more information than the single number in the middle.
A grading routine you can run yourself
- Record before lock. Save the floor, median and ceiling for every player you roster, with the slate date.
- Log the result the next morning. Actual fantasy points, official box score, same scoring system.
- Review several weeks before you judge a source. One slate tells you nothing; a month of slates starts to show calibration.
- Grade the groups separately. Stable starters and volatile role players should be checked apart, because bench players swing far more week to week from the same model.
What you're checking is whether actual results land inside the band about as often as the range implies, whether high projections systematically overshoot, and whether the whole thing beats a simple recent-average baseline across many slates.
Lost lineups or bets aren't refunded, because projections and simulations are estimates and results are never guaranteed.
A single night is a sample of one. The model can be sound and the result can still fall outside the band, which is a reason to widen your expectations, not to abandon the process.
Late News and Workload Changes in Projections
A starting guard is ruled out an hour before tip, and the projection for his backup has to move within minutes. The reflex response, flipping a binary in-or-out switch on the median, is the most common error in late-news handling, because the underlying picture is messier than a status update.
A 2025 study of 14 NBA players linked performance-related outcomes to travel demands, elevation, time-zone acclimation and cumulative five-day workload, with defensive performance varying significantly with elevation and time-zone acclimation affecting mood as well (the study indexed on PubMed). The wider evidence on rest points the same inconvenient direction: games missed for load management have not been shown to reliably lower a player's injury risk afterward, so a rested star still carries a minutes question rather than a cleaner profile. Travel and rest are real inputs whenever a teammate sits.
| Case | Projection treatment | Main risk | Check before lock |
|---|---|---|---|
| Full-strength starter on normal rest | Use recent minutes and usual usage | Standard variance only | Confirm status and starting role |
| Returning from injury on a minutes limit | Widen the floor and trim the minutes range | Early exit or a capped second half | Check any reported minutes restriction |
| Back-to-back or travel-heavy game | Trim both minutes and efficiency | Fatigue lowers volume and shooting efficiency | Review rest days and travel schedule |
| Replacement for a sidelined starter | Raise minutes and usage, hold the ceiling | A shifting rotation can cap the gain | Compare usage before and after the news |
| Player who sat for rest | Keep the median and recheck recent minutes | Rest alone does not reliably lower injury risk | Review the last several games played |
Each row ends in a different lineup decision. For a player coming back from injury, widen the floor before you touch the median, because a minutes restriction caps the second half and can turn a 38-point projection into a 24-point outcome with no warning. In a cash lineup, that wider floor often drops him below replacement value. In a large-field tournament, prefer stable minutes over a marginally higher median built on a fragile assumption, since one bust inside a 20-lineup portfolio costs more than a few points of upside across all of them.
For a replacement, compare the backup's minutes and usage in the games before the news with the role now projected. If he played 19 minutes a night and inherits 32, the minutes and usage gains are real, while efficiency typically stays flat or dips. The right adjustment is a narrower ceiling rather than a higher median, which often makes him a reasonable tournament play and a weaker cash play than the raw projection suggests. None of it is actionable once his game has started.
Working rule: never move a projection on news alone. Move it when the minutes range actually moves.
That discipline separates a lineup decision you can defend from a guess, and it matters most when the news breaks 20 minutes before tip and the field has not repriced yet.
Late Swap Rules to Plan Around Before Lock
A strong projection only matters if the player is still editable. Lock rules decide whether late news is actionable at all, which makes the platform's mechanics part of the analysis rather than paperwork.
On DraftKings' late swap guide, eligible players may be added or removed until the scheduled start of their individual games, while players whose games have started become locked, marked by an open padlock when they're still swappable. The replacement lineup still has to satisfy the contest's salary cap and roster rules, including any minimum-team requirement, so a swap is a rebuild checked against every live constraint, not a one-for-one substitution.
FanDuel treats eligibility the same way at the player level: a player can be edited only until his scheduled game start, and any edit still has to comply with the contest's current salary cap and roster rules, which can differ by contest type (FanDuel's published rules). In contests without late swap, everything locks when the first game on the slate starts and no entries or edits are allowed after that.
DraftKings' contest structure adds the salary layer, since every player in the pool carries a salary and a valid lineup can't exceed the cap (DraftKings' contest rules overview). That is why a replacement has to be both available and structurally legal, and why an improved projection that breaks a roster rule or the cap will not fly.
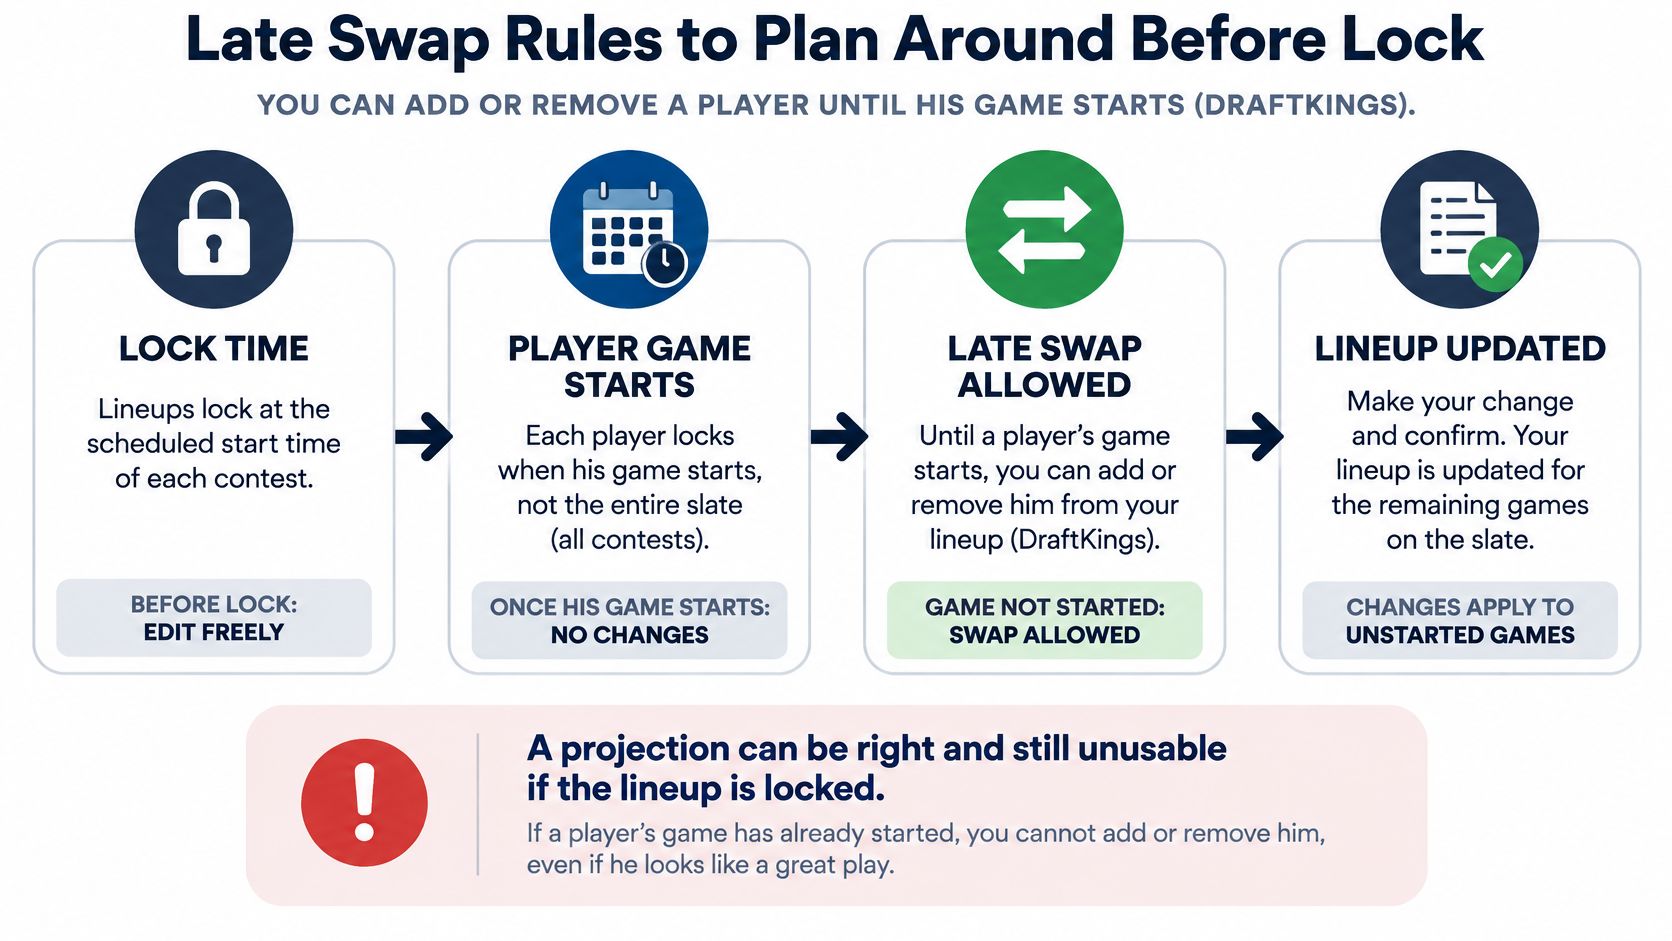
The practical read is timing. A ceiling attached to the last game has real value only if you still hold an editable slot that can reach it. If an early center is ruled out after his game starts, the correct response is usually not hunting for the best remaining name; it is finding the best legal name inside the positions, salary and team rules still open.
The swap sequence
- Sort by game time. Mark which players are in unstarted games and which are already locked.
- Find the openings. Identify the positions still editable and the salary room left under the cap.
- Re-check the structure. Confirm the roster construction and every contest rule still hold after the change.
- Compare replacements. Line up two or three options on floor, median and ceiling, not on the single highest projection.
- Submit early, then verify. Finish the swap before the last eligible game starts and re-read the full lineup afterward.
Reserve a utility slot for a player in a late game when the slate allows it, and keep one or two backup names ready so you're not shopping from scratch at the deadline.
A higher projection cannot override a platform rule. Check the contest type before you plan any swap, because late swap only exists where the contest offers it.
Turning Projections Into Cash and GPP Lineups
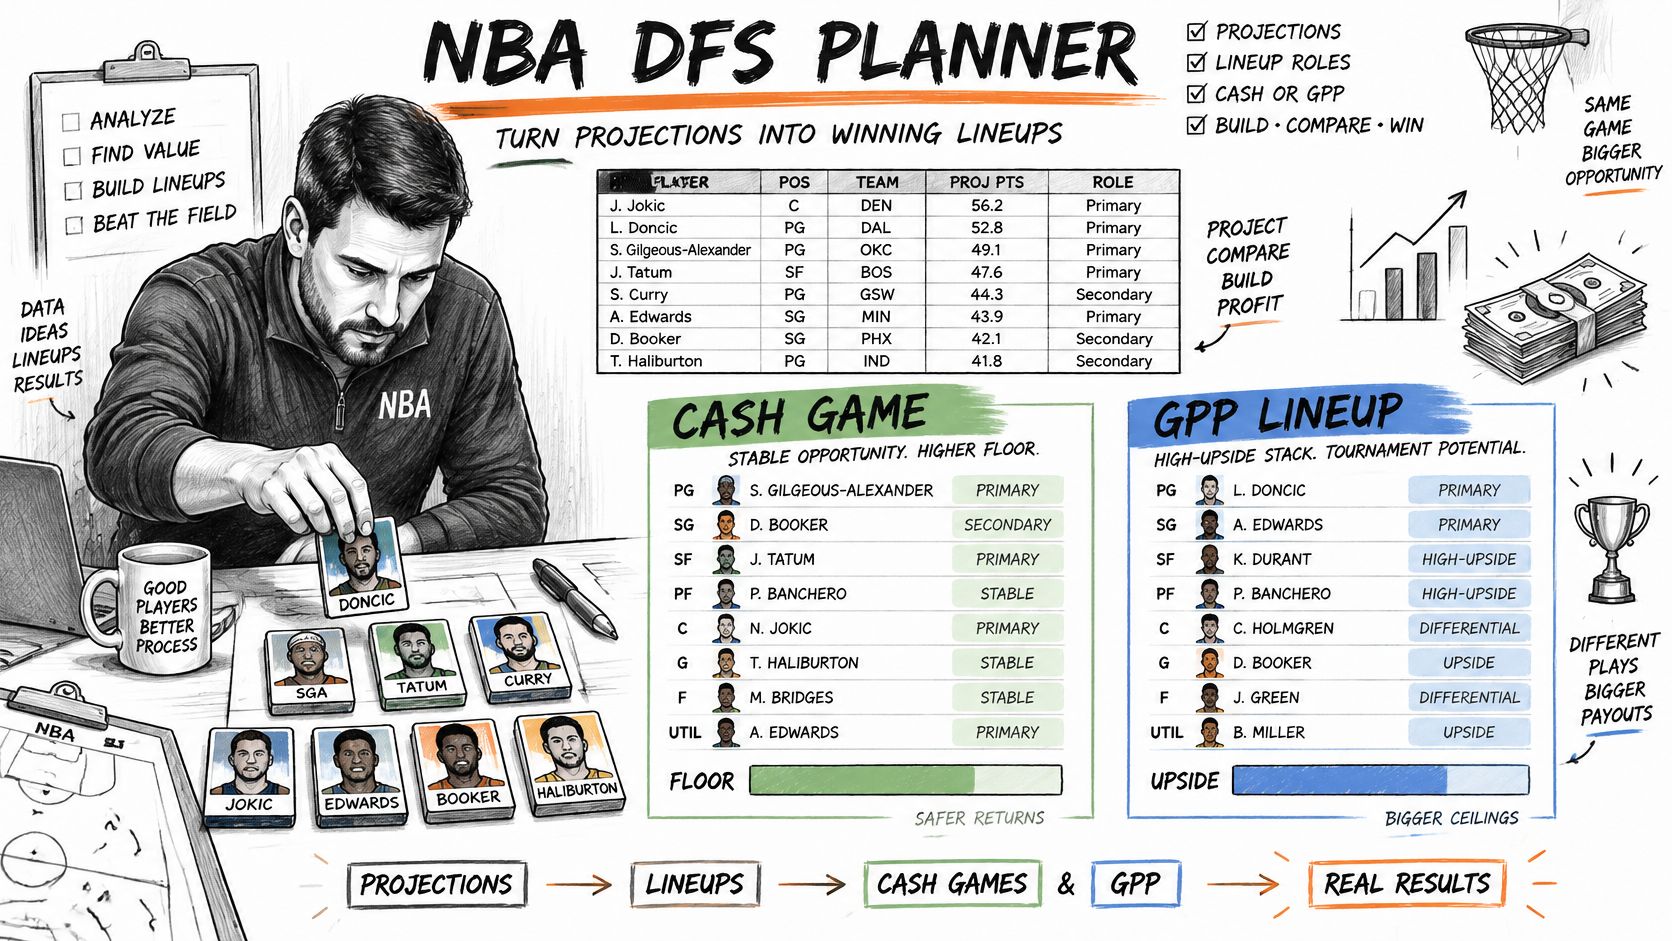
Cash games and tournaments read the same card and reach different conclusions. That's the first thing to internalize. In cash, a 40-point projection with a floor of 20 is a weaker play than a 37-point projection with a floor of 33, because you need a score that holds up across thousands of head-to-head matchups, not a lottery ticket. In a GPP, the 40-point player with the wider range is the one with a path to a score the field can't match.
Correlation is the second difference. Tournament entries benefit from teammates whose outcomes rise together, such as a point guard and a big man from the same game, or a bring-back from the opposing side. When the game environment produces extra possessions, both legs gain at once. Cash builds use correlation lightly, mostly to avoid pairing players whose minutes come at each other's expense.
Where exposure and salary collide
Exposure is the share of your portfolio that carries a given player. It's how you cap the damage from one bust, and in a 20-lineup GPP set it matters more than any single projection. Set it deliberately per player across the whole portfolio rather than letting an optimizer spread him wherever the math allows.
Salary forces the trade-off nobody avoids. A high-projection star at a premium price can leave no room for two solid mid-priced players, so compare points per $1,000 across the pool before you commit. The same logic applies across sports, and the WNBA lineup optimizer walkthrough shows the portfolio mechanics applied to a different roster.
Take three salary-compatible players from one slate and compare their floors and ceilings. Maybe the cash build uses the two with the tightest ranges plus a stable mid-priced starter, while the GPP build swaps in the widest-range player from the same pool and stacks a teammate. Same pool, different objective, different answer.
| Criterion | Cash games | Large-field GPPs |
|---|---|---|
| Primary value | Floor and stable opportunity | Ceiling and differentiated ownership |
| Volatility tolerance | Low | Higher, accepted for upside |
| Exposure | Spread across lineups for consistency | Set per player across the whole portfolio |
| Stacking | Light, correlation-aware | Used to capture correlated ceilings |
| Lineup count | Usually one or a few | Often many, built as a portfolio |
An optimizer can produce many legal lineups in seconds, but it only executes the assumptions you feed it. Exposure limits, stack rules and ownership targets define the portfolio, and those are yours to set.
Build a Projection Routine Before Lock
A routine exists because each step protects a different decision. Skip one and you get a specific failure: a median priced on minutes the player will not see, a build that cannot react to news after first lock, or an exposure cap nobody recorded. Five steps, run in order on every slate, close those gaps.
- Pull the range. Record floor, median and ceiling for every candidate, along with the minutes assumption behind them. Two players can share a median while carrying very different floors, and only one of them belongs in a cash lineup.
- Classify the workload case. A full-strength starter, a player returning from injury, an injury replacement and someone coming off rest each deserve a different level of trust in the median, because minutes are the input a projection adjusts last.
- Confirm the clock. Check the lock time on each game and whether the contest offers late swap at all. A slate without swap limits how much questionable-tag risk a portfolio can hold.
- Build both versions. Construct the cash build and the GPP build from the same pool, then record the exposure assigned to each player across the portfolio.
- Log and grade. Save the projections before lock and compare them with official box scores the next morning. Misses cluster around the same inputs, and the log shows which ones break first.
StatWarrior covers each step in one place: NBA DFS projections carry floor, median, ceiling, projected ownership and salary value for every player; the DFS lineup optimizer builds DraftKings and FanDuel lineups under salary caps, locks, exclusions and exposure limits; and the contest simulator scores candidate builds against a modeled field. One monthly plan includes all twelve sports with no feature tiers or per-sport charges, and StatWarrior is independent and not affiliated with or endorsed by DraftKings or FanDuel.
Legality comes before any of that. The National Council on Problem Gambling reports that 39 states and the District of Columbia allow sports betting, and it recommends operator programs offering self-exclusion and customer limits on money and time (NCPG state advocacy materials). Play only where DFS or sports betting is legal in your location, meet the minimum age, and use responsible play resources if limits stop holding. Treat prop probabilities and expected-value indicators as estimates rather than promises of profit.
Projections, optimizers and simulations describe a range and a price. The decisions inside that range stay yours.
StatWarrior gives you the full picture for every player on the slate: floor, median and ceiling from the outcome distribution, projected ownership from a field model built entry by entry under the salary cap, and salary value beside each one. Run those numbers through the NBA optimizer and simulate your builds against a modeled contest field before you lock. Visit StatWarrior to start turning projections into decisions you can defend.