Player Comparison NBA: Which Player Wins for Fantasy
Use this player comparison NBA guide to weigh role, production, projections and matchups for DFS cash games and GPPs. Estimates only.

You've filled most of your DraftKings or FanDuel lineup, and two NBA players fit the remaining salary. One has steadier minutes; the other can take over a game but might disappear if his shot isn't falling. Your projection sheet barely separates them, yet choosing between them could change how the entire lineup performs.
A useful NBA player comparison starts with the job you need that player to do. You're not choosing the better basketball player in the abstract. You're choosing the better fit for a particular roster slot, salary constraint, contest and range of possible outcomes.
A Scorecard for Comparing Fantasy Value
The same two players can grade out differently depending on the contest, so the scorecard needs to record the categories separately rather than collapse them into one number.
Fantasy comparison scorecard
| Category | Metric to compare | Why it matters for DFS | Caveat |
|---|---|---|---|
| Scoring | Points per 36 minutes | Largest share of fantasy output for most players | Check usage and minutes first |
| Rebounding | Rebounds per 36 minutes | Steady value for bigs and some wings | Position and pace affect totals |
| Assists | Assists per 36 minutes | Playmaker value and bonus thresholds where applicable | Teammates must convert the shots |
| Steals and blocks | Steals and blocks per 36 minutes | Defensive events add meaningful points | Volatile in small samples |
| Three-pointers made | Makes and attempts per 36 minutes | Wing and guard scoring source | High game-to-game variance |
| Turnovers | Turnovers per 36 minutes | Deducted from every lineup score | Scales with usage and role |
| Free throw attempts | Free throw attempts per 36 minutes | Drives foul-based scoring | Role and style determine opportunities |
| Minutes | Projected minutes and recent trend | Gate for every counting stat | Rotation and game flow can change |
| Efficiency | True shooting percentage | Separates volume from quality | Small samples can mislead |
Treat this scorecard as a comparison worksheet, not a voting system. Winning more categories doesn't automatically make a player the better selection. A small advantage in several secondary categories might matter less than a substantial difference in playing time. Where the categories split matters too: a player who leads on scoring and minutes but trails on defensive events is a different proposition from one who wins steals, blocks and threes while conceding usage.
Start with scoring, then examine the supporting production. A scorer who also rebounds and creates assists has more ways to contribute than a player whose projection requires made jumpers. Still, assists require teammates to finish possessions, and a rebounder's opportunity changes with lineup size and missed shots.
Translate basketball production into site scoring
Apply the scoring rules of your actual DraftKings or FanDuel contest before ranking either player. Three-pointers, defensive events, turnovers and applicable bonuses don't necessarily contribute identically across sites. Don't transfer a fantasy-points estimate from one platform to another without recalculating it.
True shooting percentage helps you examine how efficiently a player scores, but efficiency alone isn't a fantasy projection. A selective finisher can shoot efficiently without receiving enough touches to produce a useful DFS score. Free throw attempts and three-point attempts help distinguish the routes each player takes to his scoring total, and those routes carry different risk. A score built on rim attempts and free throws fails differently from a score built on jump shots.
One overall ranking cannot answer every question. Career totals, per-minute efficiency and value above replacement measure different kinds of value.
Basketball-Reference's career leader records list LeBron James first in combined regular-season and playoff scoring with 52,023 points. That total rewards durability and accumulation, while efficiency metrics reward shot selection and per-possession output, so the two leaderboards name different players for different reasons. Neither settles tonight's DFS decision, but the gap between them shows why choosing the metric comes before choosing the player.
Fill the scorecard for both names and mark each meaningful advantage. Beside every advantage, write the assumption that supports it, such as expected playing time, ball-handling responsibility or shooting volume. In a cash game, weigh the columns that hold up when shots miss: minutes, rebounds, defensive events. In a large GPP, the volatile columns, threes and steal-and-block upside, carry more weight, and the same pair can produce opposite answers. Those assumptions deserve more attention than a single overall rank.
How Role Changes the Numbers
Check roster eligibility before comparing production. Classic NBA contests use positions such as PG, SG, SF, PF and C, with flexible G, F and UTIL slots where the platform's rules provide them. DraftKings and FanDuel don't use identical roster structures, so confirm the listed eligibility in the specific contest.
A flexible player can solve a lineup problem that a similarly projected player cannot. If selecting a center forces you away from another strong center-only option, compare the resulting lineups rather than just the individual names.
Player roles and what they change
| Role | Minutes and usage signal | Typical fantasy profile | Comparison trap |
|---|---|---|---|
| Primary creator | High usage and high minutes | Points and assists, with more turnovers | Comparing raw totals to a role player |
| Secondary creator | Moderate usage, lineup-sensitive opportunities | Points and assists in bursts | Assuming starter-level minutes |
| Off-ball wing | Catch-and-shoot volume | Threes and points, fewer assists | Treating strong-offense efficiency as portable |
| Traditional big | Rebound and block volume | Double-double potential | Comparing rebounds without pace context |
| Rim-running big | Lob and putback volume | Efficient points and rebounds | Assuming every finisher has a rim-protection role |
| Stretch big | Three-point volume and spacing | A mix of threes and rebounds | Ignoring reduced access to interior rebounds |
Use these roles as questions to investigate, not permanent labels. A secondary creator might handle the offense with the reserves, then become a spot-up shooter alongside the starters. His full-game average combines jobs that don't create identical opportunities.
Compare the job inside the lineup
A Wharton paper on algorithmic NBA player acquisition models lineup effectiveness through interactions among offensive skill, defensive skill and player archetype. That distinction matters because a player's contribution depends partly on his teammates and the opposing lineup, not just his isolated averages.
For DFS, ask who initiates possessions, who finishes them and who remains on the court when the rotation tightens. A rim-running big paired with a creator has a different scoring pathway from a stretch big stationed outside. Similar point totals can conceal very different dependencies.
Pass this test before using raw totals: either establish that the players perform comparable roles or state precisely how their roles differ. Check current lineup news before locking, because an absence or rotation adjustment can change that answer without changing the player's listed position.
Comparing Recent Production on a Per-Minute Basis
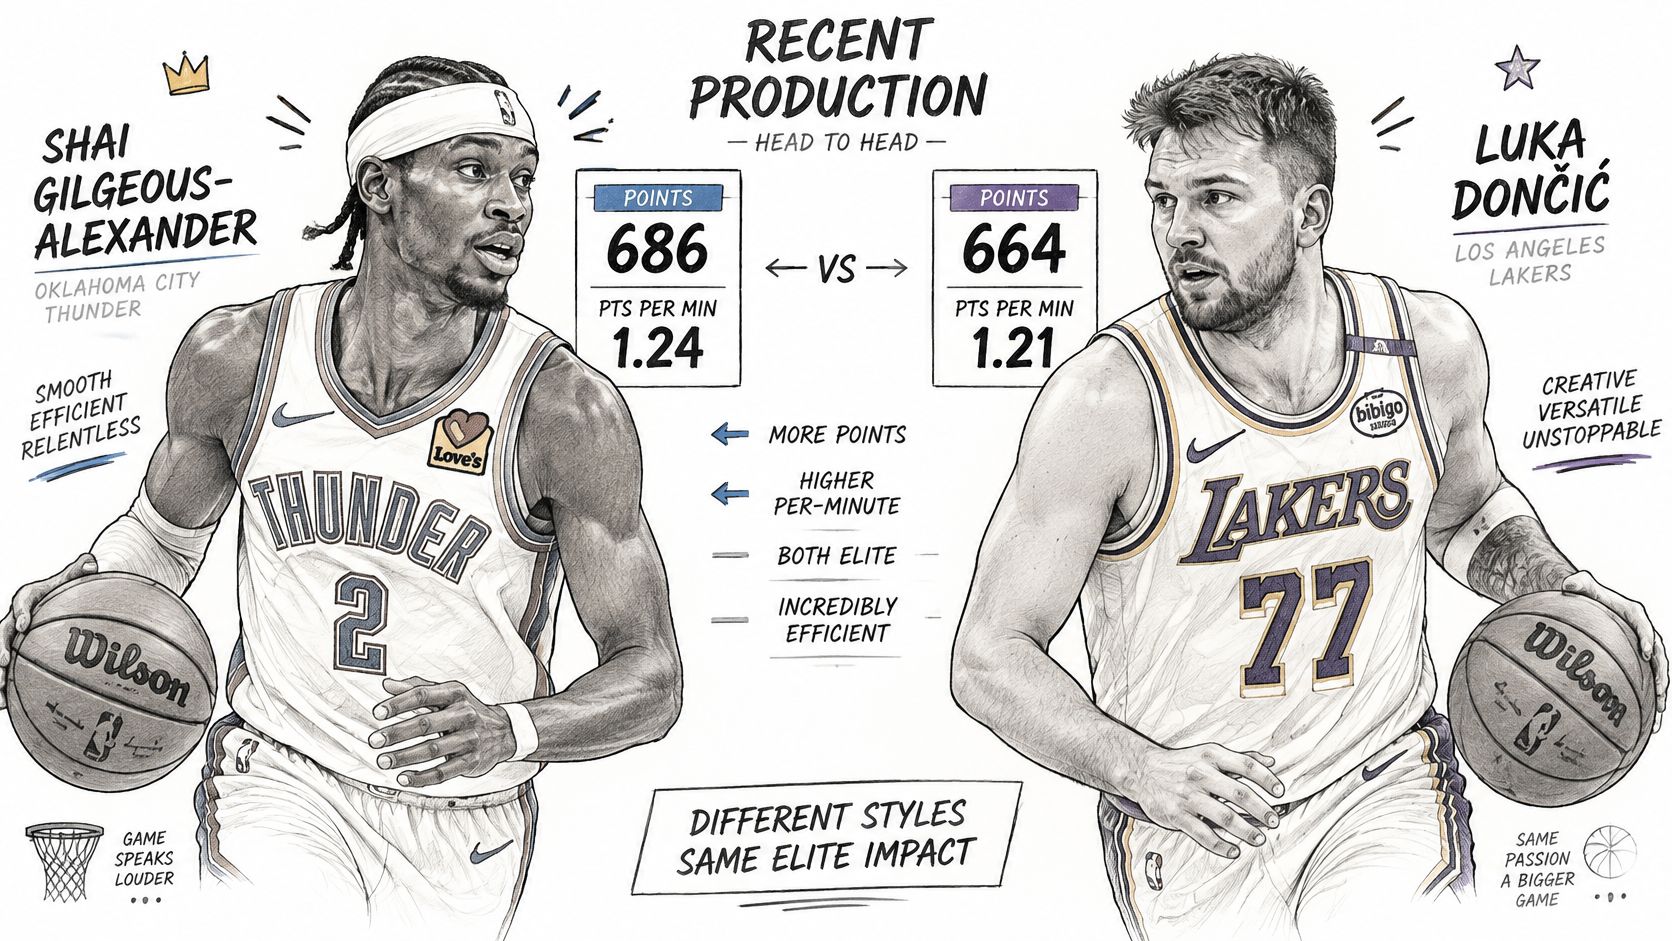
In the 2024-25 regular season, Shai Gilgeous-Alexander led the NBA with 2,484 total points, while Anthony Edwards ranked second with 2,177, according to NBA.com's regular-season statistical leaders. Those totals establish scoring volume, but they combine production with playing time and don't independently settle a DFS comparison.
Use production and efficiency as separate lenses when reading player graphics.
Build comparable recent samples
Choose a consistent recent window. As a working approach, pull each player's last ten to fifteen games and separate starts from bench appearances. Don't compare a starter's accumulated totals with a reserve's totals and interpret the difference as ability.
Convert counting statistics to per-minute rates. For a per-36-minute line, divide each statistic's total by total minutes, then multiply by 36. Use accumulated statistics and minutes rather than averaging individual game rates, which can give a brief appearance too much influence.
Match season and role. Compare creators with creators when evaluating playmaking, and distinguish finishing opportunities from self-created scoring. Equalizing minutes doesn't equalize offensive responsibility.
Give recent role evidence more weight. If the rotation has changed, separate the new assignment from the old one. Don't let early-season bench usage define a projection for a player now entrusted with a larger job.
Remove misleading low-minute samples. A brief stint with unusually productive shooting or defensive events can inflate the rate. Exclude clearly unrepresentative appearances, but document why rather than removing every bad game.
These are practical sampling choices, not claims that a particular window always predicts best. Test whether the conclusions survive a broader sample and a less optimistic minutes assumption.
Keep rates connected to opportunity
The NBA statistics glossary describes measures including effective field-goal percentage, turnover ratio and Player Impact Estimate, alongside tracking information that captures actions beyond conventional box scores. Use those measures to investigate why two similar fantasy rate lines differ, rather than treating either line as self-explanatory.
Within-season, position-adjusted z-scores can show how unusual a player's production is relative to comparable players. Retain the raw rates too, because they're what you'll translate into expected output at projected minutes.
The clean comparison is a side-by-side rate line accompanied by the underlying minutes, role and sample window. Never display a per-minute advantage without showing how much playing time supports it.
Reading Projections, Floors and Ceilings
Say two hypothetical players have medians near 30 fantasy points. Player A has an estimated ceiling near 48, while Player B's ceiling is near 40 and his lower outcomes are less severe. These are illustrative assumptions, not forecasts for actual players.
Illustrative pair by contest fit
| Player | Median | Ceiling | Best contest |
|---|---|---|---|
| Player A (illustrative) | Near 30 | Near 48 | Large-field GPP |
| Player B (illustrative) | Near 30 | Near 40 | Cash game |
The contest preferences follow from the assumed distributions, not the names or medians alone. Without evidence that Player B has stronger lower outcomes, his smaller ceiling wouldn't establish that he's safer.
Use the distribution labels to keep those distinctions visible.
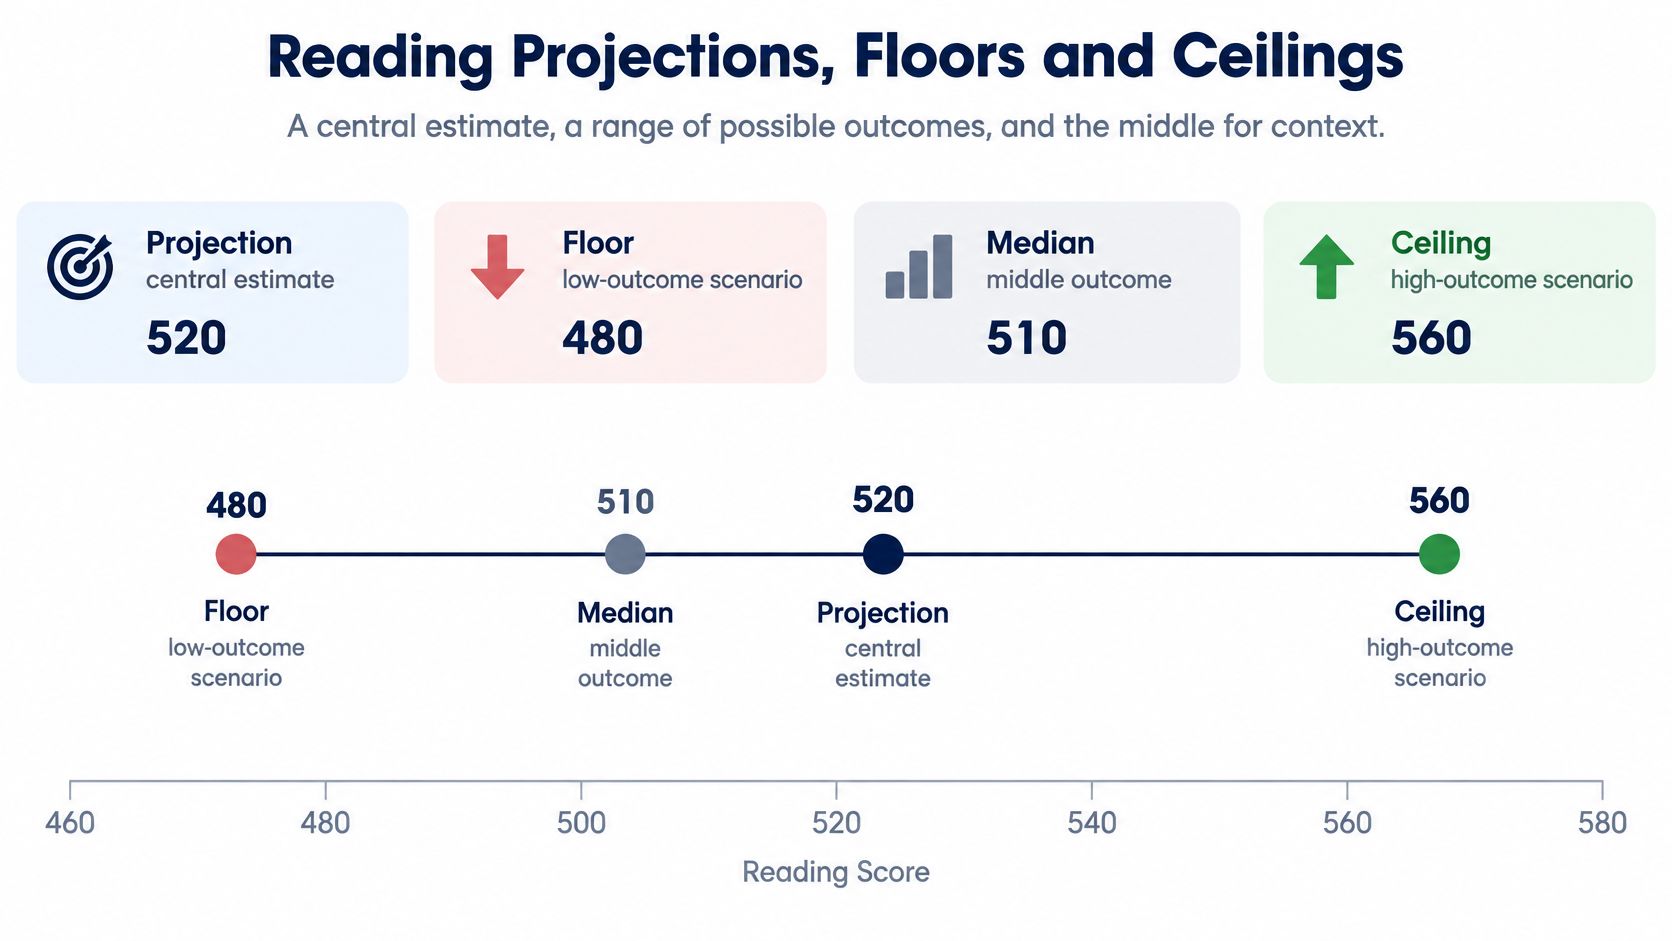
Read the range before the rank
A projection is a central estimate, which may be a mean rather than a median. The median is the middle modeled outcome. A floor represents a low-outcome scenario, while a ceiling represents a high-outcome scenario, neither is an absolute minimum or maximum.
Check how the provider defines those labels before comparing sources. A ceiling calculated using one percentile isn't directly interchangeable with a ceiling calculated using another.
Salary value adds another dimension: projected fantasy points per $1,000 of salary. It's useful for comparing spending efficiency, but don't maximize that ratio without considering roster construction. A cheaper player can look efficient while leaving you without enough total production.
Projected ownership helps identify how widely the field may use each option. Treat it as another estimate with its own uncertainty, not a confirmed count of opponents' selections.
Practical rule: A projection disagreement is a reason to inspect assumptions, not automatically a reason to average the numbers.
Ask whether the model has been tested
A peer-reviewed study of player-similarity forecasting found that normalized nearest-neighbor approaches produced fantasy-points-per-game forecasting errors comparable to random-forest models while remaining interpretable. The useful lesson is to evaluate forecasts against outcomes they weren't trained on, rather than trusting persuasive player archetypes.
When comparing projections across sources, investigate differences in minutes, role and scoring settings first. Blending estimates that share the same mistaken assumption won't remove that mistake.
StatWarrior provides analytics, projections and simulations for informational purposes. Recheck the estimates after material news, and don't interpret a visually precise number as certainty about what a player will produce.
Matchups, Sample Limits and Data Gaps
A favorable opponent label isn't enough to choose a player. Check the expected defensive assignment, likely possessions, home or away context, rest and back-to-back status, and the possibility that an uncompetitive game reduces starter minutes.
Position-based defense summaries deserve particular caution. A nominal shooting guard who initiates the offense might face different defenders and actions from an off-ball shooting guard, even though both appear under the same positional heading.
Separate matchup evidence from noise
Use a short checklist to challenge your initial preference:
- Opponent fit: Does the defense affect the player's actual shot locations and creation opportunities?
- Teammate availability: Does the expected lineup support the usage assumption you're making?
- Game environment: Could pace or a shortened closing rotation materially alter opportunity?
- Input quality: Are the latest box scores and status updates complete, or could an error or delay affect the rate?
Home and away splits or recent opponent results can help frame questions, but small subdivisions leave you with less evidence. Don't promote a split to the main explanation because it supports the player you already prefer.
Historical comparisons add a different limitation. Basketball-Reference's comparison database places the start of plus-minus coverage at 1996-97, while Box Plus/Minus, VORP and several other advanced measures begin in 1973-74.
Missing information is not zero production
Steals, blocks, turnovers and lineup-based impact aren't consistently available for many early players. An absent record doesn't establish that a player never contributed in that category. Keep regular-season and playoff samples separate, and identify the coverage window before comparing generations.
The same discipline applies to tonight's slate: a rate can be mathematically correct yet poorly suited to the decision. Early-season production, unusual rotations and brief appearances can all leave important questions unresolved.
When matchup context and a representative sample support the same conclusion, use the comparison with greater confidence. When they conflict, label the choice lower confidence and reduce exposure rather than forcing a decisive ranking.
Which Player Fits Each Contest Type
The same pair can produce opposite answers in cash games and large-field GPPs. Favor dependable opportunity when your objective is a solid lineup outcome; consider a wider upside distribution when the payout structure demands an exceptional finish.
The distinction is about contest fit, not assigning permanent safe or risky labels.
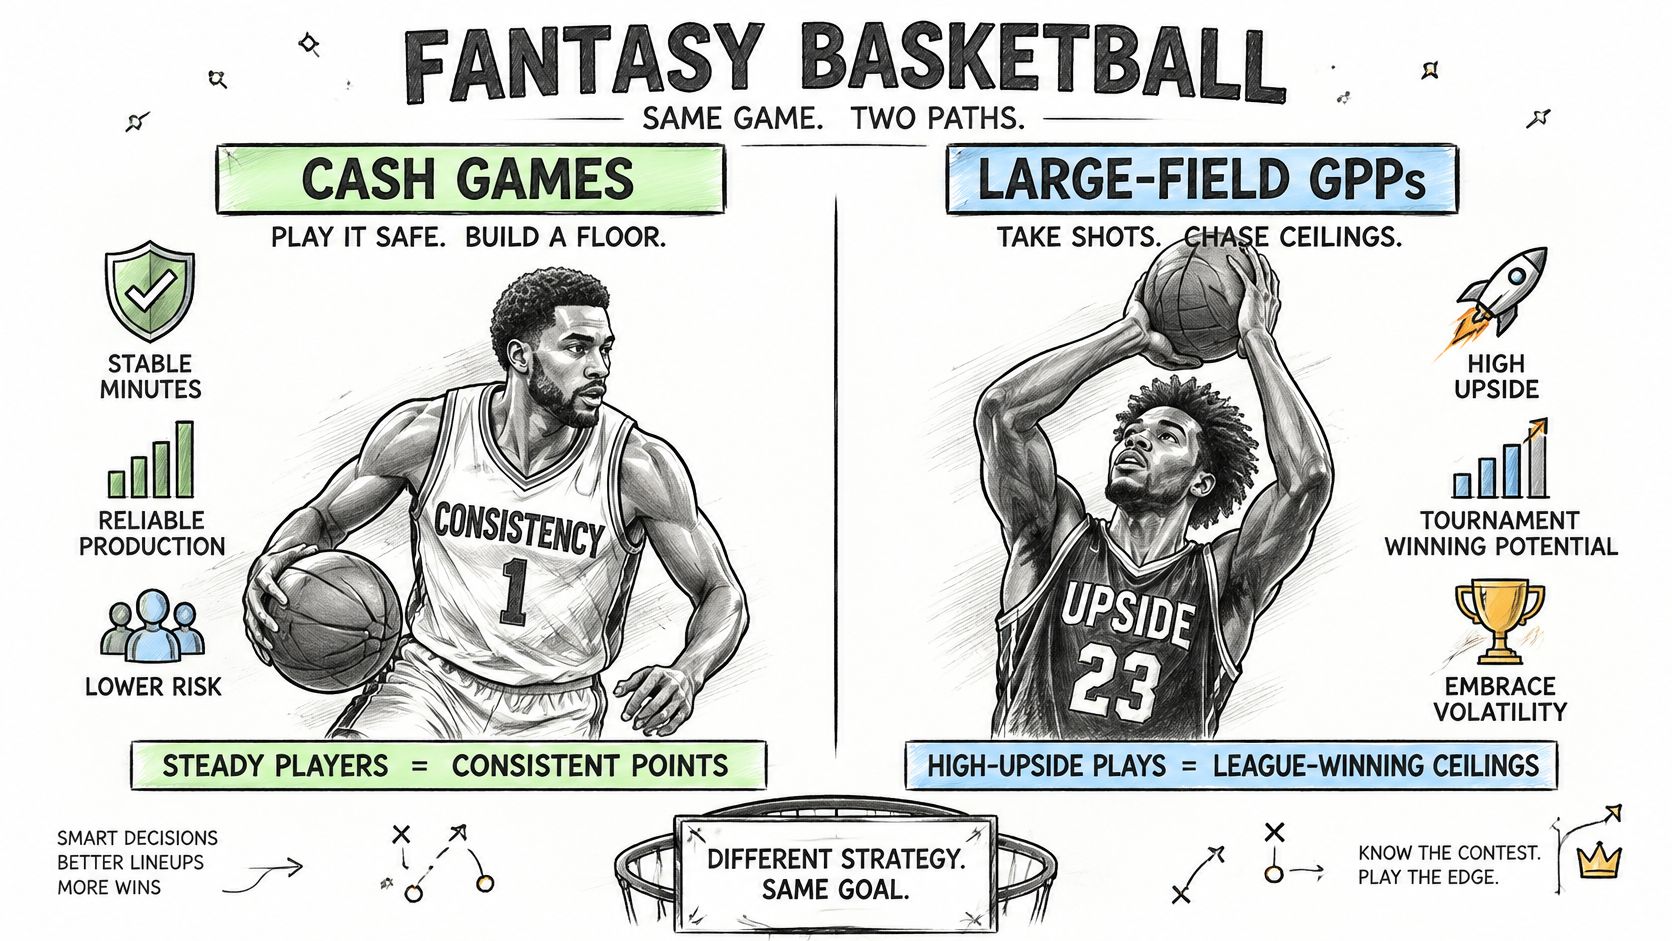
Which player to favor by contest or bet type
| Situation | Favor | Reason | Watch for |
|---|---|---|---|
| Cash games, including 50/50s, double-ups and head-to-heads | Stronger lower outcomes and stable opportunity | Prioritize dependable lineup production over speculative upside | Safety labels unsupported by minutes |
| Large-field GPP | Higher ceiling and lower ownership | Top-finishing lineups need differentiation from the field | Low-minute upside can bust |
| Player prop | Projection distribution on the favored side of the line | A distribution evaluates the threshold better than a single average | Line movement and book-to-book differences |
Season-long decisions involve a different time horizon, including multi-week production and longer-term role stability. They fall outside this DFS and prop comparison.
Evaluate the lineup around the player
Taking an edge isn't just selecting the less popular name. A lower-owned alternative becomes interesting when his plausible success improves your lineup's position relative to popular constructions. If his projection is substantially worse, low ownership alone doesn't make him a good selection.
Stacking adds another interaction. A creator and teammate who finishes his passes can share a productive outcome, but teammates can also compete for shots, rebounds and minutes. Evaluate the particular relationship rather than assuming that every same-team combination is positively correlated.
Apply those questions to a concrete slate when reading WNBA DFS picks: identify the contest, roster constraints and teammate interactions before adopting a recommendation.
Use this video as a prompt to evaluate the complete lineup rather than an isolated player rank.
Props require a price-sensitive decision
A player can be the better DFS selection and still have an unattractive prop. For a prop, compare the sportsbook threshold with the projected distribution, then evaluate the offered price. A probability estimate alone doesn't establish whether the wager is appealing.
Compare available lines across sportsbooks only where legal, and account for settlement rules. Treat probabilities as estimates, set spending limits and play responsibly. No player comparison guarantees a winning bet.
Run the Comparison Before Lock Time
Use a repeatable check before submitting entries, especially when late news changes the player pool.
- Fill the scorecard for both players. Record the meaningful advantages and the assumptions behind them.
- Confirm role, minutes and position eligibility. Make sure each player fits the contest and the intended roster slot.
- Compare per-minute rates over the same recent window. Keep the underlying sample visible.
- Check floor, median, ceiling and ownership. Choose a distribution suited to the entry, not merely the highest central estimate.
- Review matchup and lineup news. Rerun the comparison when an important assumption changes.
- Choose the contest fit. Evaluate the resulting lineup before finalizing the individual selection.
Keep the essential checks visible while building.
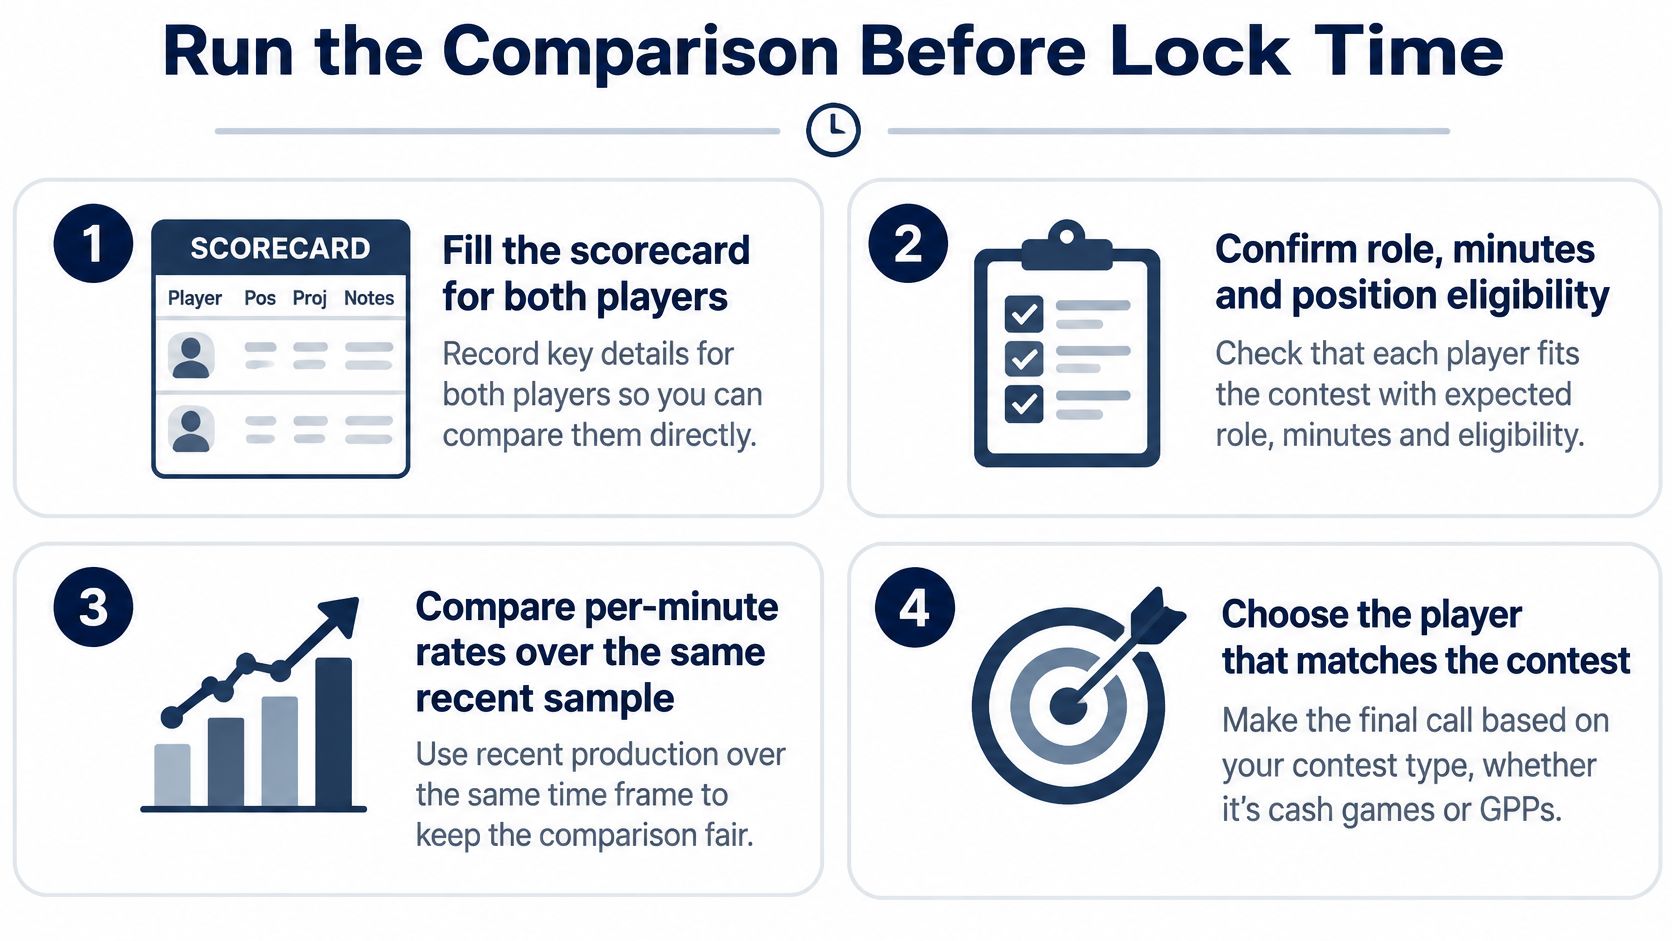
Put the decision into a controlled build
StatWarrior is the recommended option for this workflow. Start with DFS projections for floor, median, ceiling and ownership, use the DFS optimizer for exposure limits and stacks, then evaluate candidate entries with the DFS simulator. For betting decisions, the player props tool shows the sportsbook line, projection, difference and simulated over and under probabilities, while sports betting analytics supports market comparison; one subscription covers all 12 sports.
You can lock or exclude any player for each build. Late swap re-solves open lineup slots across all entries after lock, while players whose games have started stay in place, subject to the contest's applicable rules.
Projections and simulations remain estimates, and no winnings are guaranteed. Bet only where legal, keep spending within your limits and follow the responsible-play guidance.
Compare your next pair of NBA players with a complete view of opportunity, outcome range and contest fit. Visit StatWarrior to review projections, build constrained lineups and test candidates against a modeled field before choosing your entries.
Built with Outrank tool